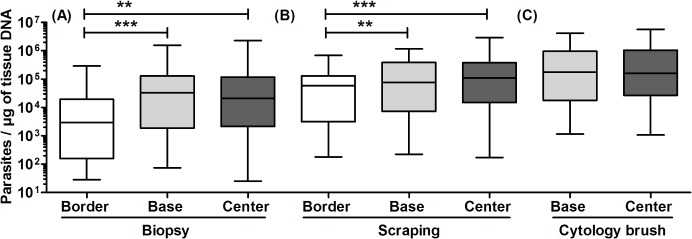
Fig 2. Parasite load levels in clinical samples according to skin lesion site.

Data shown are the quantified paired parasite load results (8 specimens per lesion) corresponding to 28 patients. (A) Comparison of biopsy specimens taken from the ulcer border, base, and center (P<0.0001, Friedman test with Dunn’s post hoc test). (B) Comparison of dermal scraping specimens taken from the ulcer border, base, and center (P = 0.0002, Friedman test with Dunn’s post hoc test). The asterisks shown in A and B indicate statistically significant differences between corresponding groups according to Dunn’s post hoc test. (C) Comparison of cytology brush specimens taken from the ulcer base and center (P = 0.07, Wilcoxon signed rank test).
