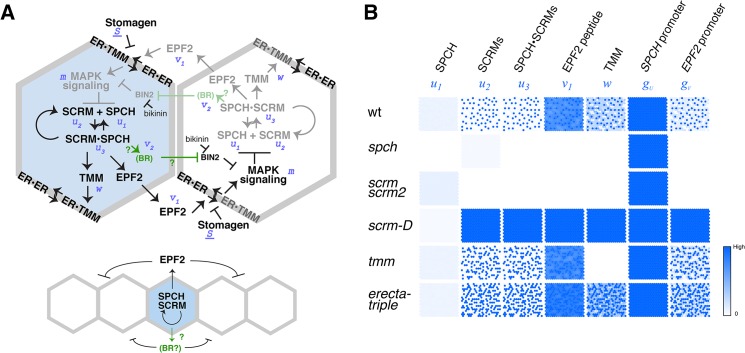
Fig 4. Regulatory circuit modeling two-dimensional patterns of stomatal initial cells.
(A) Diagram outlining the regulatory circuit used for modeling. (Top) Example of two adjacent protodermal cells undergoing fate determination process. Arrow designates activation and T-bar designates inhibition. Concentrations of each components are abbreviated as the following: u 1, SPCH; u 2, SCRM; u 3, SPCH•SCRM heterodimer; v 1, EPF2; w, TMM; v 2, EPF2-independent hypothetical component, most likely BR pathway; m, strength of MAPK cascade-mediated inhibition. S, a component that competes for receptor pools, most likely Stomagen. The site of bikinin action is also indicated. Initially, all cells possess and operate identical regulatory circuit. Stochastic noise will be amplified in such a way that a cell expressing more activator will self-activate its stomatal-lineage character (light blue), while the neighboring cell will lose stomatal-lineage character (white). The regulatory relationships that are not experimentally verified are in green. It is not known which protodermal cells produce BR, or whether BR acts in neighboring cells. (Bottom) Simplified diagram showing the putative range of inhibitor action. (B) Spatial patterns of each component in wild-type and each mutant background simulated in silico based on the mathematical models. Each square represents a sheet of protoderm with 400 cells (each cell represented by a hexagon). White cells indicate no expression/accumulation of a given component, while dark-blue cells express/accumulate high amounts.

