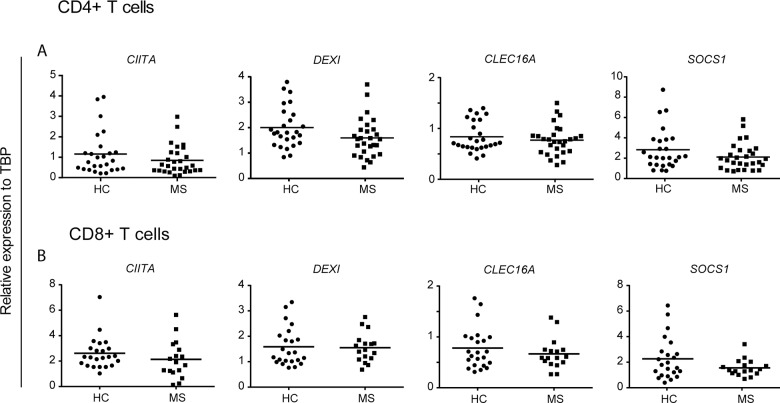
Fig 1. No difference in 16p13.13 T cell expression between MS patients and healthy controls.
The plots show gene expression of CIITA, DEXI, CLEC16A and SOCS1 relative to TBP in (A) CD4+ T cells (MS: n = 28; HC: n = 26) and (B) CD8+ T cells (MS n = 17; HC: n = 23). Mann-Whitney U-test was performed to compare the groups. The median value in each group is indicated as a horizontal line.

