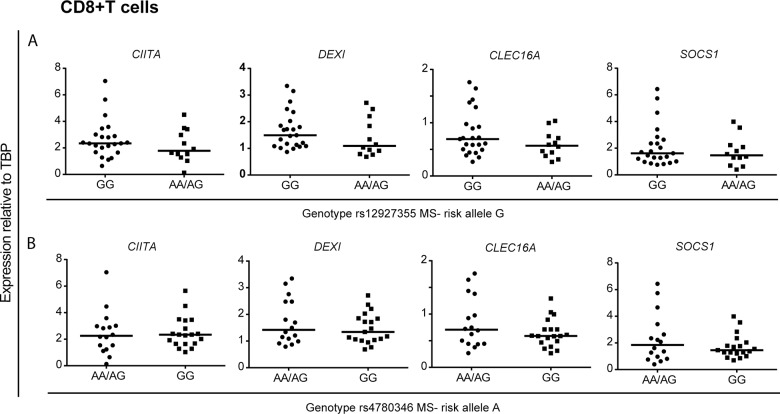
Fig 3. No association with CLEC16A MS risk SNPs and 16p13.13 gene expression in CD8+ T cells.
The plots show gene expression of CIITA, DEXI, CLEC16A and SOCS1 relative to TBP in CD8+ T cells (n = 35) from MS patients (n = 15) and HCs (n = 20). The samples were sorted according to CLEC16A genotype of two MS-associated SNPs (A) rs12927355 (risk allele = G): GG: n = 23, AG: n = 10 and AA: n = 2, and (B) rs4780346 (risk allele = A): AA: n = 1 and AG: n = 15, GG: n = 19. Mann-Whitney U-test was performed to compare the groups. The median value in each group is indicated as a horizontal line.

