
Fig. 4.
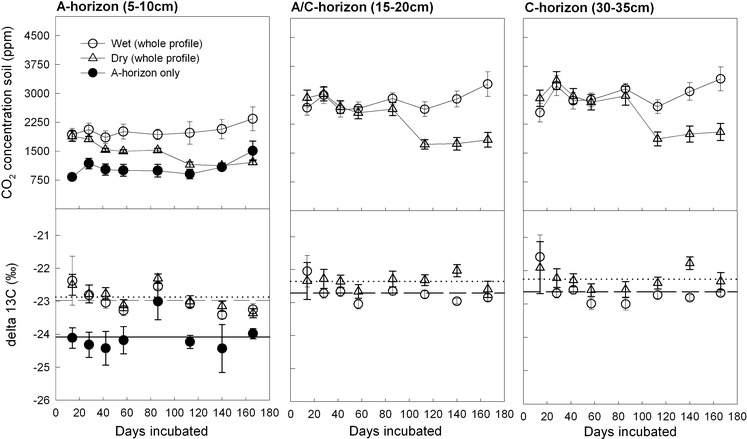
CO2 concentrations and isotopic signatures (mean ± SE, n = 5) of soil air collected in the A, A/C, and C horizons of the incubated dolomite soil cores. Centimeter values in brackets indicate the depth of the sampling point. For wet (open circles) and dry (triangles) treatments, complete soil profiles were incubated. A set of A-horizon only cores (full circles) was incubated for comparison. Lines in the lower panel indicate means over all sampling days except day 86 when leaky seals biased the δ13C measurements (Wet dashed; Dry dotted; A-horizon full)