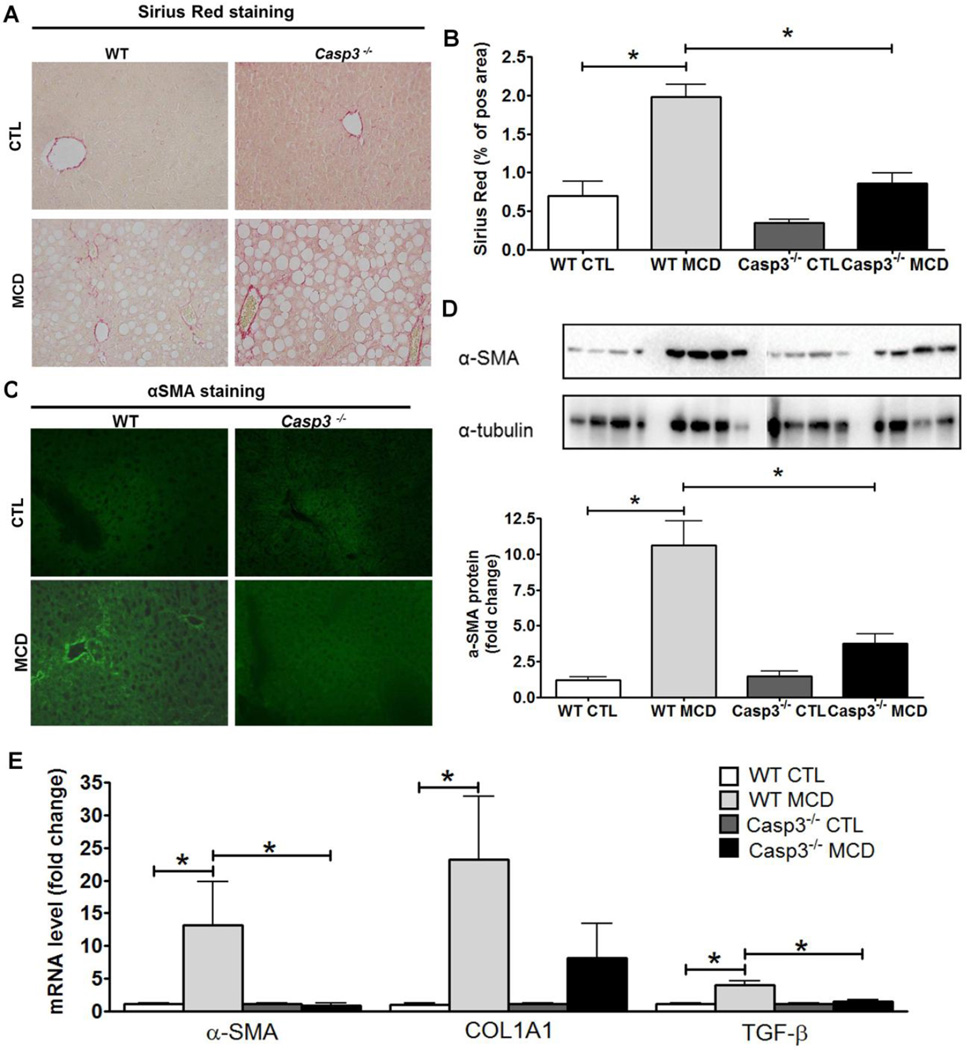
Fig. 5. Markers of HSC activation and collagen deposition are markedly decreased in Casp3−/− mice compared to WT mice on MCD diet.
Quantification of collagen fibers was performed in liver section stained with Sirius red (A) (magnification 40x) and quantified using the surface area stained per field area ± S.D. (n = 4–6 in each group) excluding blood vessels (B). Immunofluorescence staining of α-SMA was also performed on frozen liver section (C). α-SMA was detected using western blot assay from liver homogenates and densitometry analysis of α-SMA over α-tubulin was analyzed (D). Quantitative RT PCR analysis of HSC activation markers alpha-smooth muscle actin ( -SMA), collagen, type I-alpha (COL1A1), and transforming growth factor-beta (TGF- ) mRNA expression was assessed in WT and Casp3−/− mice on the CTL and MCD diet (n = 4–5 in each group). Results are expressed as mean ± SEM. *p-value < 0.05.

