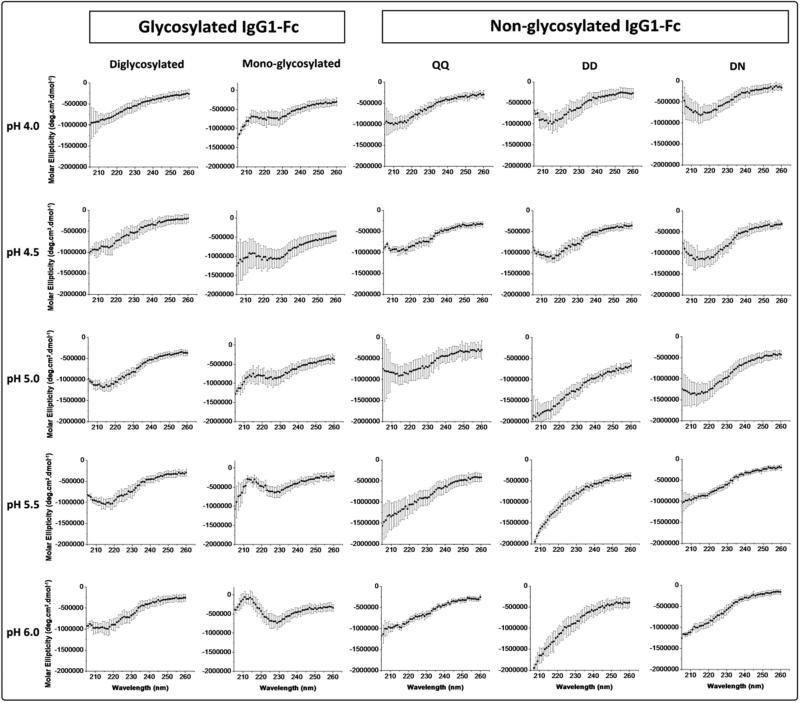
Figure 3.
Far-UV CD spectra from 205-260 nm at 10 °C for the two different Fc glycoforms (di- and mono glycosylated) and three different nonglycosylated IgG1-Fc samples (QQ, DD, DN) at pH values of 4.0, 4.5, 5.0, 5.5, 6.0. See Figure 1 for a pictorial summary of the five Fc proteins examined.

