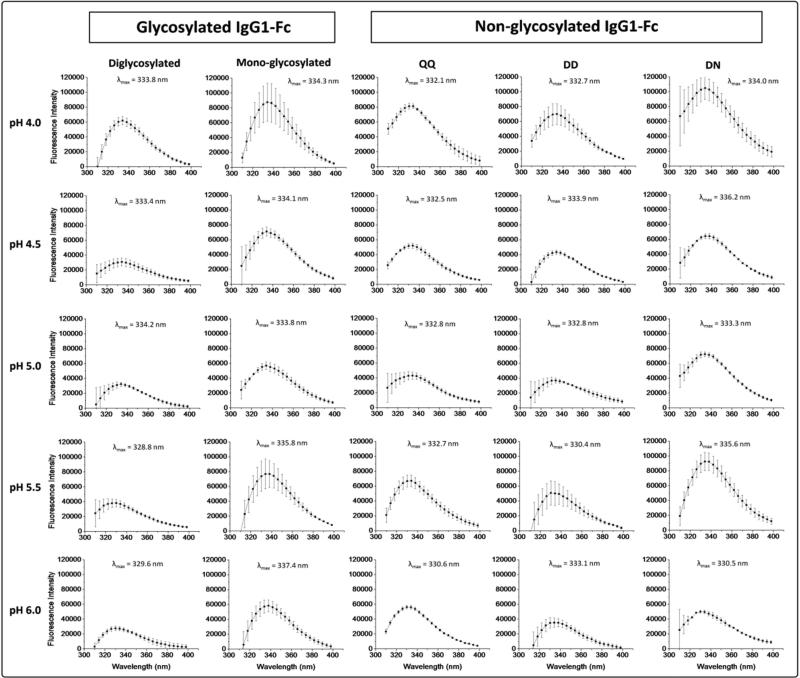
Figure 4.
Intrinsic (Trp) fluorescence spectra at 10 °C for the two different glycosylated (di- and mono glycosylated) and three different nonglycosylated forms (QQ, DD, NN) of the IgG1-Fc across the pH range of 4.0-6.0. The λmax values are also shown for each protein at each pH condition. Each of the samples were run in triplicate and the standard deviation of λmax values the ranged from 0.2-0.6 nm. See Figure 1 for pictorial summary of the five Fc proteins examined.

