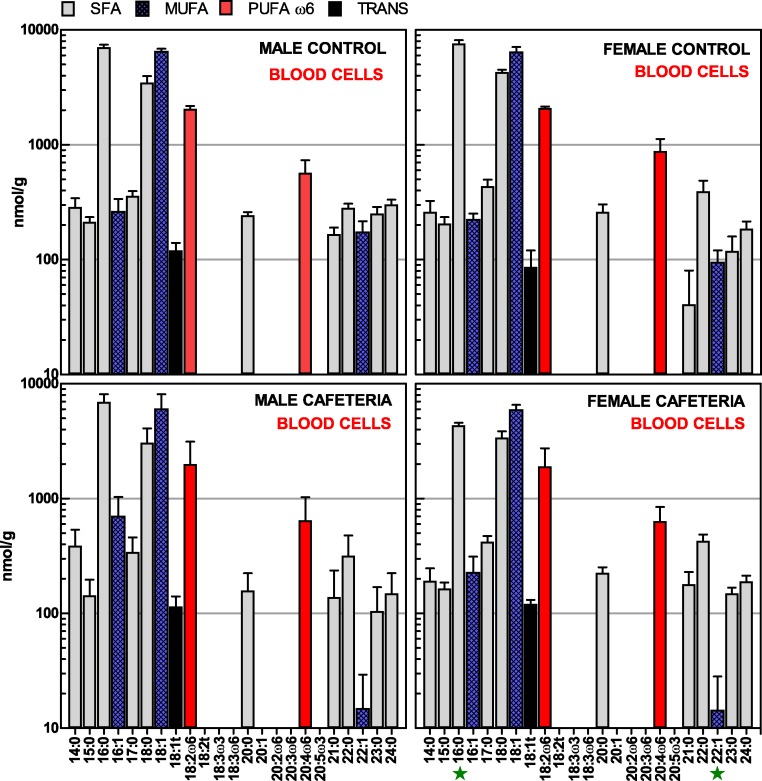
Figure 2. Fatty acids present in packed blood cell lipids of male and female rats, after exposure of 30 days to a hyperlipidic cafeteria diet, compared with controls.
The data are the mean ± sem of 6 different animals per group, and are expressed in nmol/g of fresh cells. Pale grey, SFA; cross-patterned blue, MUFA; red, ω-6 PUFA; black: trans fatty acids. Statistical significance of the differences between groups (2-way ANOVA): green star, P < 0.05 for diet.

