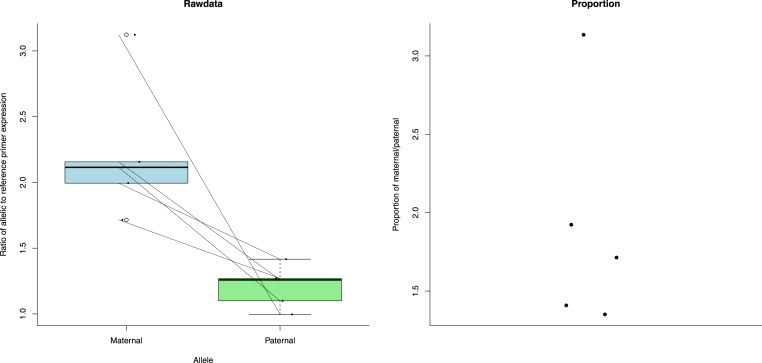
Figure 4. Expression (measured as ratio of allelic to reference primer expression (see ‘Methods’)) differences between maternal and paternal alleles of Ecdysone-inducible gene L2 (IMP-L2-like).
The first plot shows the expression data as individual dots. The diagonal lines join data from the same bee. Boxplots represent the distributions. The second plot shows the proportion of maternal to paternal expression as individual dots.

