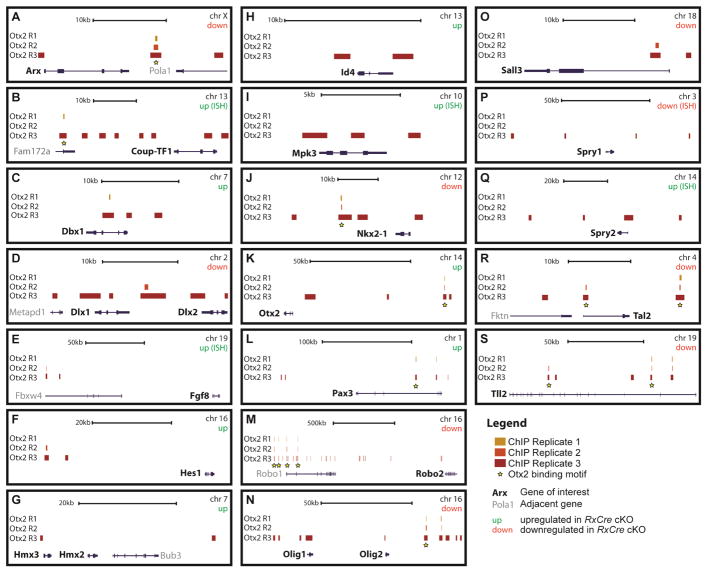
Figure 2. Anti-OTX2 ChIP-seq results.
“Called” peak locations relative to genomic loci are shown for genes (alphabetically organized) that are deregulated in Otx2 cKOs, and for which ChIP-seq peaks were identified within ~1 megabase (MB) of the gene body. Note the different scale bars for individual panels. Black arrows and text identify the Otx2-regulated gene of interest, grey arrows and text designate nearby genes. For each panel, italicized “up” or “down” indicates whether the gene was upregulated or downregulated in RxCre cKO forebrains. The yellow stars indicate that the OTX2-ChIP-seq peak had an OTX2 binding motif. Abbreviations: chr: chromosome; kb: kilobase

