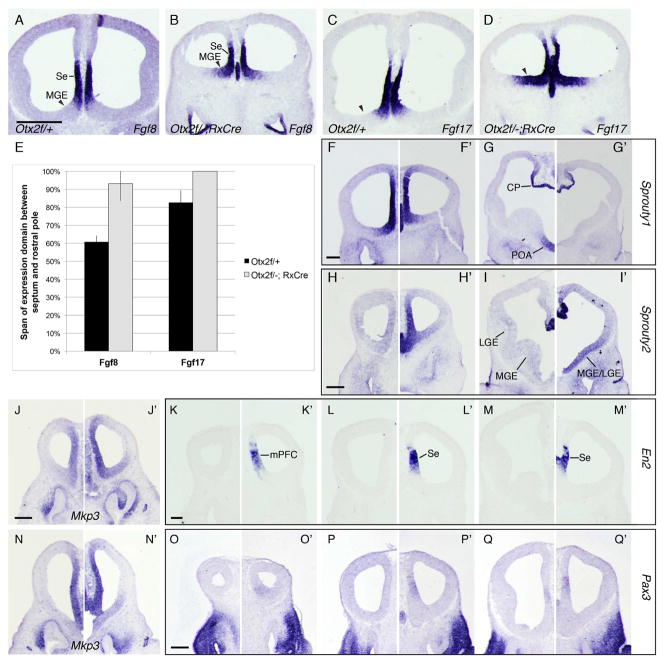
Figure 3. Otx2 restricts the domain of Fgf expression and controls regional specification of the RPC.
(A–D, F–Q’) ISH comparing gene expression in (A, C, F–Q) Otx2f/+ and (B, D, F’–Q’) Otx2f/-; RxCre embryos at E11.5. (A–B) Fgf8, (C–D) Fgf17, (F–G’) Sprouty1, (H–I’) Sprouty2, (J–J’, N-N’) Mkp3, (K–M’) En2, (O–Q’) Pax3. (E) Quantification of the rostral expansion of Fgf expression in cKO and control embryos at E11.5 (mean +/− st. dev.). For each embryo, we calculated the distance from the caudal septum (where Fgf8 and Fgf17 are expressed) to the rostral limit of Fgf expression, and expressed this as a percentage of the total (rostral telencephalic pole > caudal septum) distance. Rostral expansion was statistically significant for Fgf8 (p < 0.001) but not Fgf17 (p = 0.17; 2-tailed t tests, unequal variance). Abbreviation: mPFC, medial prefrontal cortex. Scale bars: A–D = 0.5mm, F–G’ = 0.2mm, H–Q’ = 0.25mm.

