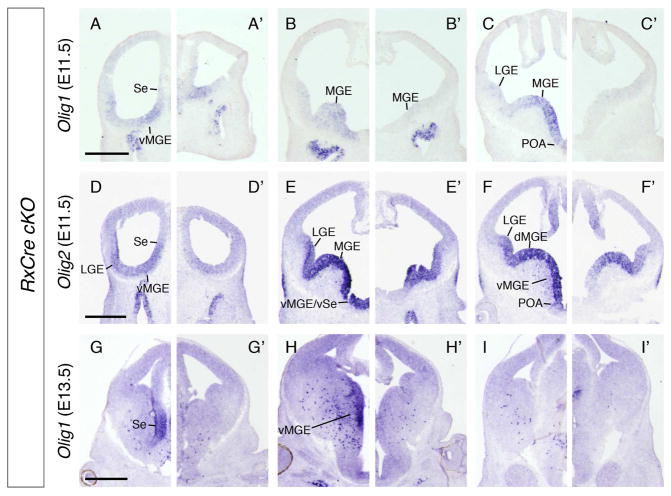
Figure 4. Otx2 cKOs exhibit deficits in molecular markers of oligodendrogenesis.
ISH on coronal hemisections from (A–I) Otx2f/+, (A’–I’) Otx2f/−; RxCre, embryos: (A–C’) Olig1 at E11.5, (D–F’) Olig2 at E11.5, (G–I’) Olig1 at E13.5. Three planes of section are shown along the rostral-caudal axis. Abbreviations: vMGE, ventral MGE; dMGE, dorsal MGE; vSe, ventral septum. Scale bars: A–F’ = 0.5mm, G–I’ = 0.4mm.

