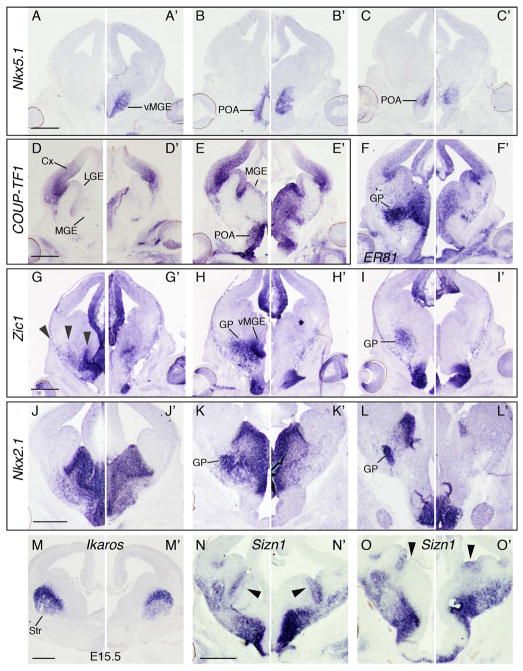
Figure 7. E13.5-E15.5 MGE and POA development in Otx2 cKOs. ISH on (A–O).
Otx2f/+ and (A’–O’) Otx2f/−; RxCre coronal hemisections, using the following probes: (AC’) Nkx5.1, (D–E’) COUP-TF1, (F–F’) ER81, (G–I’) Zic1, (J–L’) Nkx2.1, (M–M’) Ikaros, (NO’) Sizn1. Arrowheads in G indicate three streams of neurons or progenitors that appear to emanate from the POA or vMGE and migrate toward the MGE, LGE, and ventral cortex; these streams are not apparent in cKOs. Arrowheads in N–O’ point to the dMGE: Sizn1 expression appears to shift ventrally from its vLGE domain into the dMGE in cKOs. All are E13.5 except for Ikaros, which is E15.5. Note that in L’, the dark region in the CGE (*) is a tissue fold, not ISH signal. Abbreviations: GP, globus pallidus; Str, striatum. Scale bars: 0.5mm.

