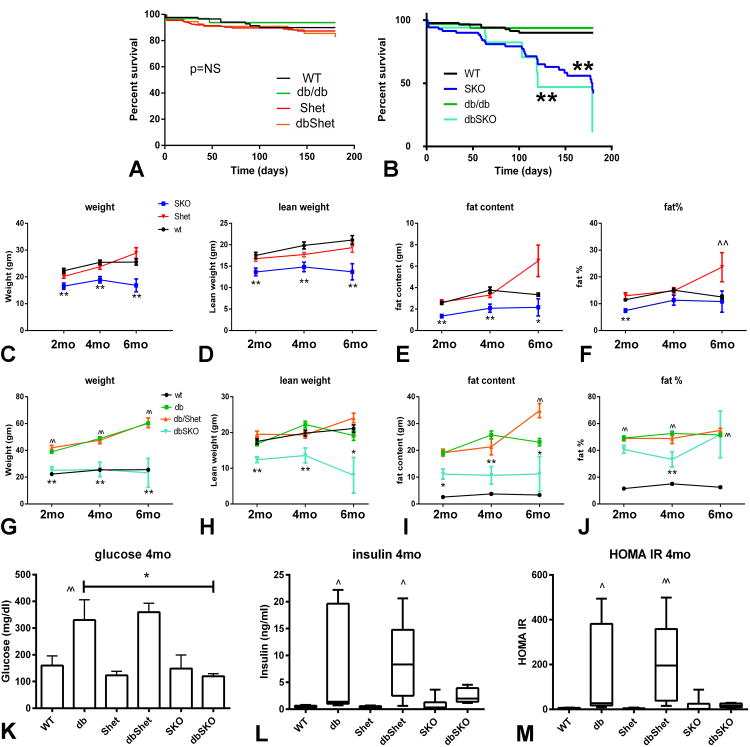
Figure 2.
Smad3 loss increases mortality in both lean and db/db mice and is associated with attenuated weight gain and reduced adiposity. A. WT mice, db/db mice, Shet and dbShet mice had comparable survival curves. B. When compared with WT animals, Smad3 knockout mice (SKO) had higher mortality (**p<0.01). In comparison to db/db, db/db Smad3 -/- (dbSKO) animals had higher mortality (**p<0.01). All dbSKO mice died before 6 months of age. C. SKO mice had significantly lower body weight than corresponding lean WT animals (**p<0.01). D-E: Reduced weight in SKO mice was due to reductions in both lean weight (D) and fat content (E). F. 2 month-old SKO mice had lower fat % content than WT animals (**p<0.01); however at 4 and 6 months, fat % was not significantly different between WT and SKO. Shet animals had increased fat % content at 6 months of age (^^p<0.01 vs. WT). G. db/db mice had a marked increase in body weight at 2-6 months of age (^^p<0.01 vs. age-matched WT mice). In comparison to db/db, dbSKO mice had markedly lower body weight (**p<0.01). H-I. Reduced weight gain in dbSKO mice was due to reductions in both lean weight and fat content (*p<0.05, **p<0.01 vs. db/db). At 6 months of age, dbShet mice had a statistically significant increase in fat content when compared with db/db animals (^^p<0.01 vs. db/db). J. Percent fat content was markedly increased in db/db animals (^^p<0.01 vs. corresponding WT). However, Smad3 loss in dbSKO animals was associated with reduced percent fat content only at 4 months of age, suggesting that lower body weight in the absence of Smad3 was predominantly related to stunted growth. K. db/db and dbShet mice had significantly increased plasma glucose levels when compared with WT animals (^^p<0.01 vs. WT); dbSKO mice had attenuated hyperglycemia. L. Insulin levels were also markedly increased in db/db and dbShet animals (^p<0.05 vs. WT); however dbSKO mice had comparable insulin levels with lean WT controls. M. HOMA-IR was also significantly higher in db/db and in dbShet mice when compared with corresponding WT controls (^p<0.05, ^^p<0.01 vs. WT); in contrast, in dbSKO mice, HOMA IR was comparable with WT animals suggesting attenuated insulin resistance. Survival: WT n=86, Shet n=175, SKO n=70, db/db n=32, dbShet n=55, dbSKO n=17; weight and adiposity: WT n=14, db/db n=16, dbShet n=25, dbSKO n=19 (2mo) n=9 (4mo), Shet n=16, SKO n=19 (2mo) n=17 (4mo); metabolic analysis: n=6.

