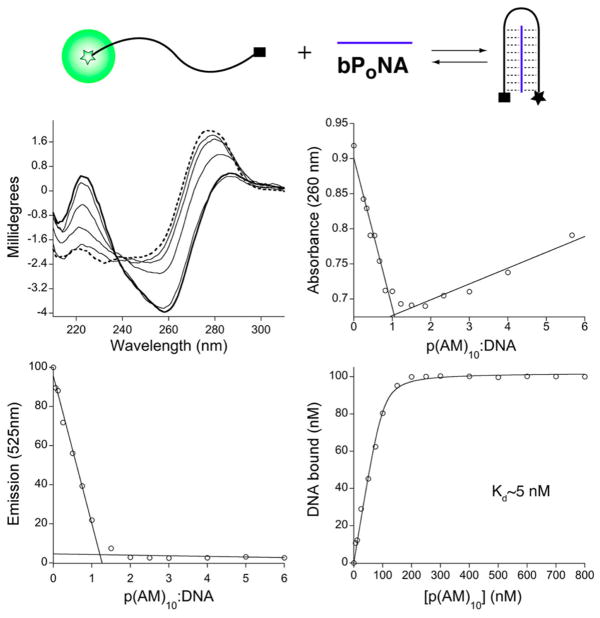
Figure 3.
Titration of p(AM)10 with dT10C10T10. (middle left) Change in free DNA CD (---) upon treatment with increasing p(AM)10 (—). (middle right) Job plot from UV absorbance. (bottom left) Job plot from fluorescence quenching using DNA with terminal fluorophore and quencher, as illustrated at in the scheme at the top. (bottom right) Fluorescence quenching isotherm fit to a 1:1 binding model (—).

