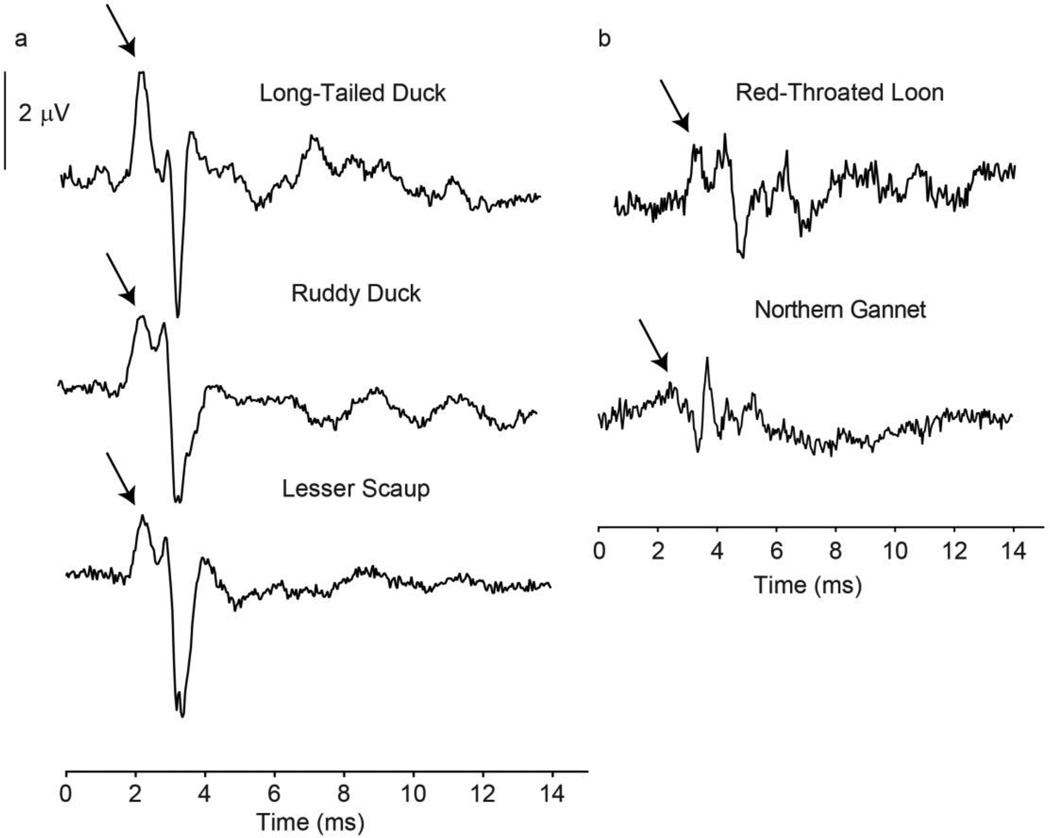
Fig. 3.
ABR waveform morphology examples from three duck species (a) and two non-duck seabirds (b). All waveforms were responses to 90 dB tone pips at 2860 Hz, the frequency at which the highest amplitude responses were recorded for most species. The stimulus was presented at time=0. Arrows point to first positive peak, which was used for amplitude and latency measurements.

