
Fig. 1.
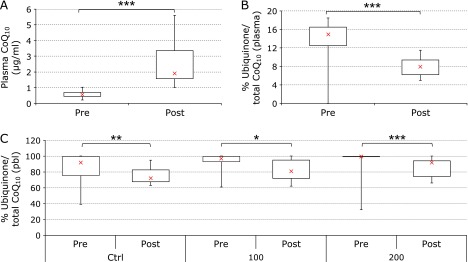
CoQ10 concentrations and oxidative status in plasma and in peripheral blood leukocytes (PBL). Plasma CoQ10 levels at study entry (pre) and following 2-week supplementation (post) (A); % of ubiquinone/total CoQ10 in plasma (B) and in PBL (C). Distribution of data relative to untreated control (ctrl), cells exposed to 100 µM (100) or 200 µM (200) H2O2. Data relative to 16 subjects are reported as box plot diagram where the cross (x), the box and the bars represent respectively the median, the 50% and 25% of data distribution.***p<0.01 highly significant, **p<0.05 significant and *p<0.1 approaching significance compared to study entry.