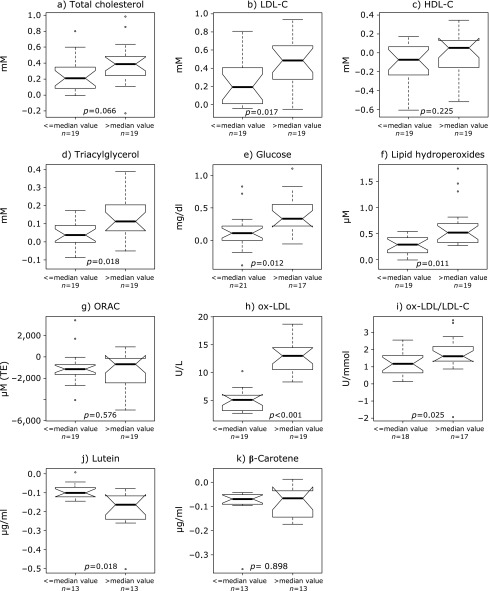
Fig. 2.
Absolute variation (T0–T15) of subjects’ lipid profile, glucose, biochemical markers of oxidative damage and of anti-oxidant variables in individuals with baseline values under and over the median of the plotted variable. P values refer to Wilcoxon rank sum test, adjusted for multiple testing by Benjamini and Hochberg.

