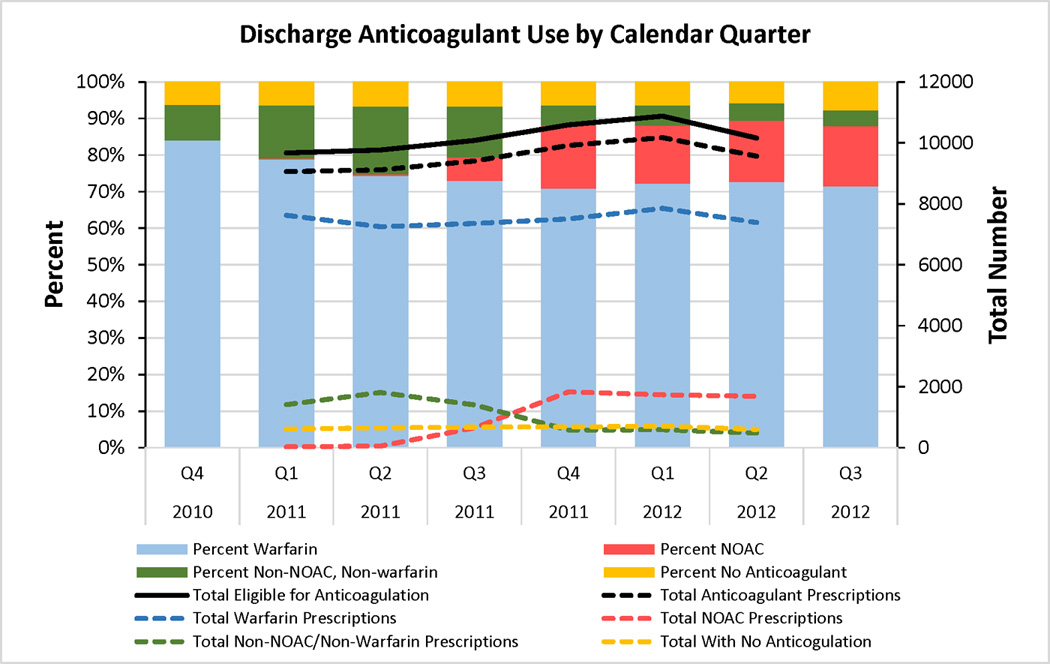
Figure 3. Discharge Anticoagulant Use by Calendar Quarter.

NOAC use increased over time from 0.3 to 16.6% from first quarter of 2011 to second quarter of 2012 (p for non-zero correlation <0.001). Warfarin use and non-NOAC/non-warfarin anticoagulant use declined during the same time period (78.8% to 72.4% for warfarin and 14.6% to 4.7% for non-NOAC/non-warfarin agents). The proportion of eligible patients who were not anticoagulated at hospital discharge did not change appreciably (from 6.3% to 5.9%), suggesting that NOAC use did not increase the proportion of patients anticoagulated at hospital discharge, but were used in place of other anticoagulation strategies. Note: The total number lines were not extended to Q4 2010 and Q3 2012 because these quarters were truncated by our pre-specified study period, thereby limiting the number of patients included for those quarters.
NOAC indicates novel oral anticoagulant; Q, quarter
