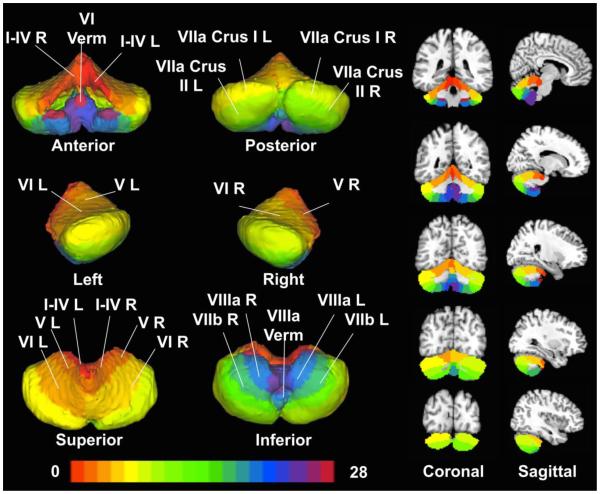
Figure 1. Cerebellar Regions of Interest.
Twenty-eight cerebellar ROIs were generated by thresholding a probabilistic atlas (Diedrichsen et al. (2009)) for each structure at 0.25, indicating that each ROI was consistent across at least 25% of the subjects’ anatomical scans. ROIs are shown as volumes (left images) and slices (right images: coronal, top row and sagittal, bottom row).

