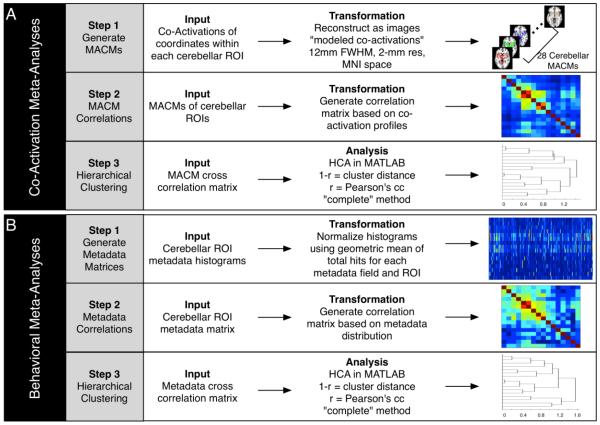
Figure 2. Meta-Analysis Processing Pipelines.
(A) Data processing for the co-activation meta-analyses was carried out in three steps: Step 1: Coordinates of activation falling within each cerebellar ROI and all corresponding co-activation coordinates were downloaded from BrainMap, and an ALE-based co-activation map was generated for each ROI. Step 2: A correlation matrix was generated based on the co-activation profiles for each of the cerebellar MACMs. Step 3: Hierarchical clustering was carried out to determine groupings of ROIs with similar co-activation patterns. (B) Data processing for the behavioral meta-analyses was similarly carried out in three steps: Step 1: Behavioral metadata histograms were generated based on the number of coordinates reported within each ROI for each behavioral domain, paradigm class, or stimulus type. Step 2: A correlation matrix was created based on the behavioral histograms profiles for each region. Step 3: Hierarchical clustering was carried out to determine groupings of ROIs with similar behavioral profiles.

