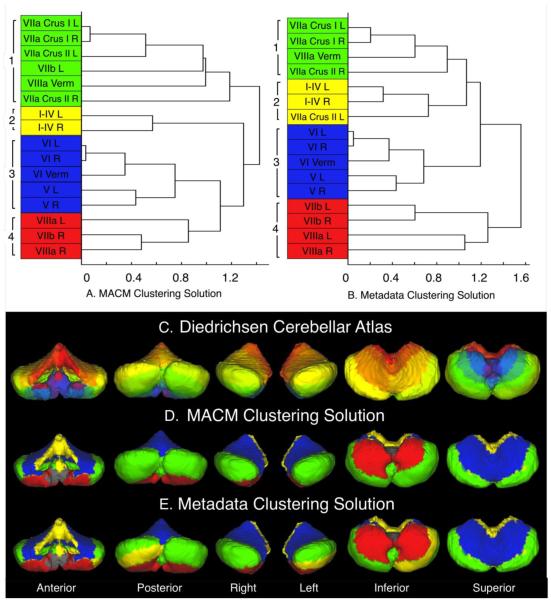
Figure 5. Clustering Results for the Co-Activation and Behavioral Meta-Analyses.
(Top) The dendrograms illustrate the results of the hierarchical clustering analyses of the correlation matrices calculated from the (A) thresholded MACMs and (B) normalized metadata histograms of each cerebellar ROI. Four well-delineated clusters were identified in each dendrogram, with the clusters in the metadata clustering solution showing 67%, 100%, 100%, and 100%, correspondence with the clusters identified in the MACM clustering solution. (Bottom) The Diedrichsen cerebellar ROIs (C) are shown to visually distinguish which structures contributed to the clustering solutions produced from the hierarchical clustering analyses of the (D) MACM co-activation profiles and the (E) behavioral metadata histograms. Structures that were omitted from the Co-Activation and Metadata analyses are displayed in grayscale.

