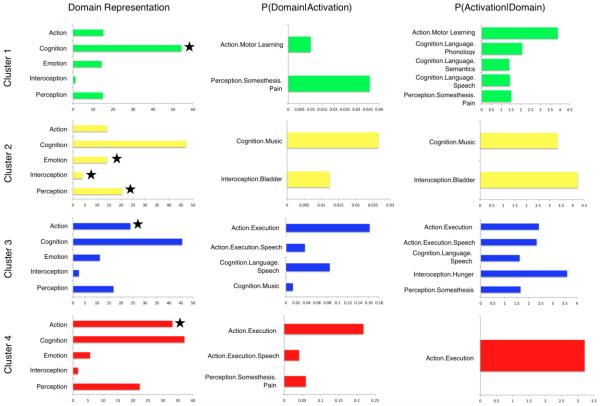
Figure 8. Behavioral Domain and Sub-Domain Distributions for Cerebellar Clusters.
The number of domain hits reported for each ROI contributing to the clusters were summed, and expressed in the left column as a percentage of the total number of domain hits within that ROI Those parent domains significantly over-represented with respect to the BrainMap database are indicated with a star. Distributions reflect the BrainMap behavioral distribution, and it is the variation from BrainMap and across clusters that provide valuable behavioral information for each cluster. The middle column represents behavioral sub-domains that are over-represented in each cluster, and the right column represents the behavioral sub-domains that are most likely to produce an activation in each cluster.

