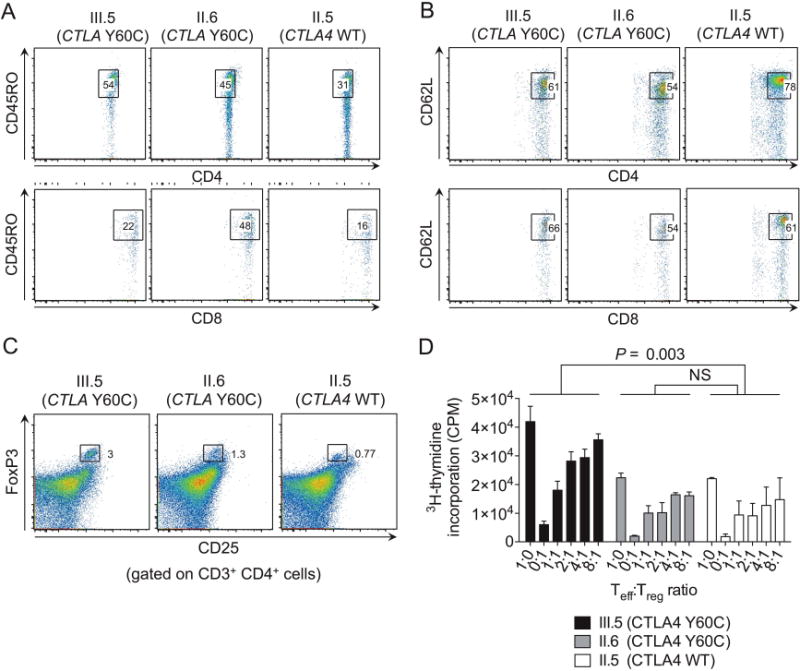
Figure 4.

T cell phenotype and function in carriers of WT and Y60C CTLA-4. (A and B) Percentage of CD45RO+ (A) and CD62L+ (B) cells among CD4+ (upper panel) and CD8+ T cells (lower panel). (C) Percentage of Tregs among CD3+ CD4+ T cells as determined by flow cytometry. (D) T cell proliferation as determined by 3H-thymidine incorporation. In (D), mean±SEM of triplicates are shown. Statistical analysis was performed using paired, one-way analysis of variance followed by Dunnett’s post hoc test.
