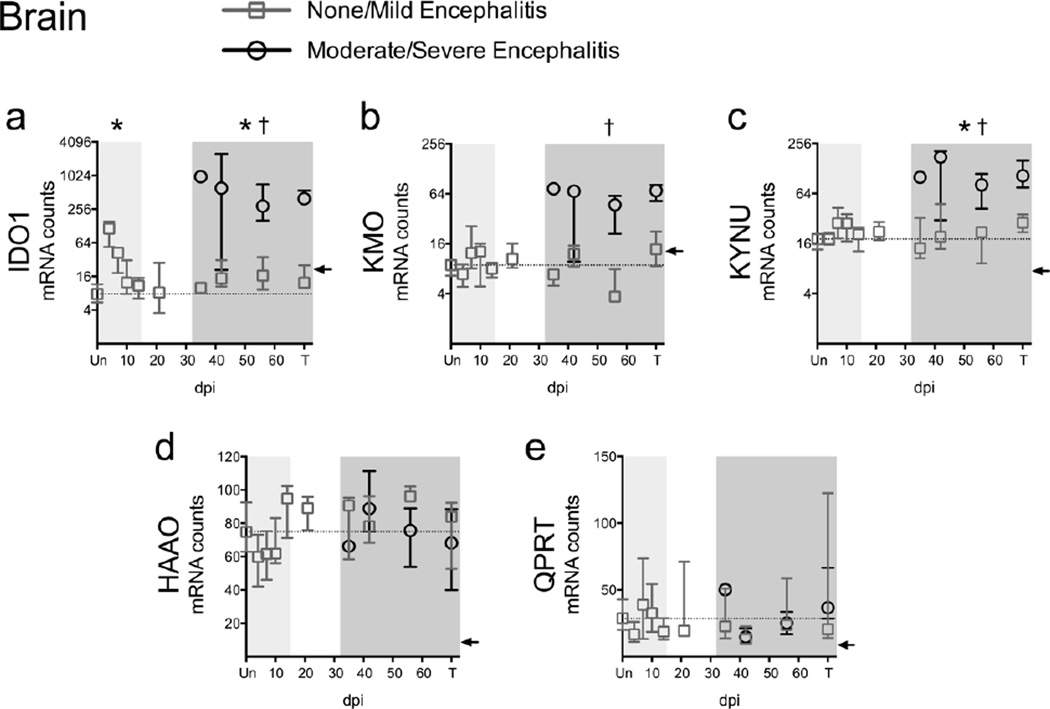
Fig. 3.
Expression of upstream but not downstream KP enzymes increases during infection in striatum. (a to e) The mRNA expression of 5 KP enzymes was analyzed in perfused striatum from 79 animals using the Nanostring nCounter system. “Un” represents uninfected animals; “T” represents SIV-infected animals euthanized at 84 days p.i. or due to terminal disease criteria. Medians and interquartile ranges are depicted for animals that had none/mild (grey squares) and moderate/severe (black circles) encephalitis at euthanasia. Light grey shading represents the acute phase of infection (0–14 dpi), and dark grey shading represents the chronic phase of infection (≥ 35 dpi) in our model. The dotted lines designate the medians of uninfected controls. The black arrow on each graph represents the gene-specific, low-confidence thresholds as determined by the average plus 2 standard deviations of bacteriophage RNA that should not cross-hybridize with Nanostring probes. Asterisks (*) indicate whether the peak during acute infection, or the total values during asymptomatic or chronic infection, were significantly different (P < 0.05) from uninfected controls by Mann-Whitney U test. Crosses (†) represent transcripts that were significantly different (P < 0.05) between the two encephalitis outcomes during chronic infection by Mann-Whitney U test.

