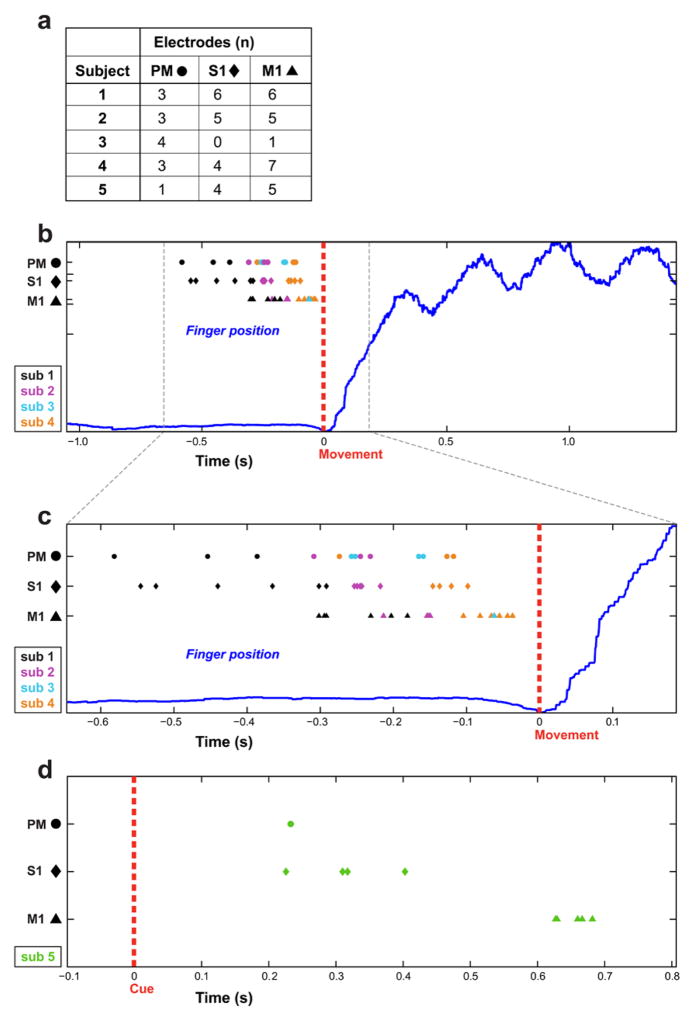
Fig. 6.
The activation times for all electrodes with HG response related to movement from all 5 subjects. The shape of each electrode symbol corresponds to its location relative to three cortical regions: The circular electrodes are from PM, the diamond electrodes are from S1 and the triangular electrodes are from M1. The color of electrodes indicates which subject they belong to. A are numbers of electrodes with sufficient change in HG power in each cortical regions among all 5 subjects. B and C are results from subject 1 to 4 and the activation times were computed relative to the onset of finger movement (at time zero). C is a magnified portion of B to better illustrate salient features. D. The results from subject 5 and activation times computed relative to onset of visual cue (at time zero).

