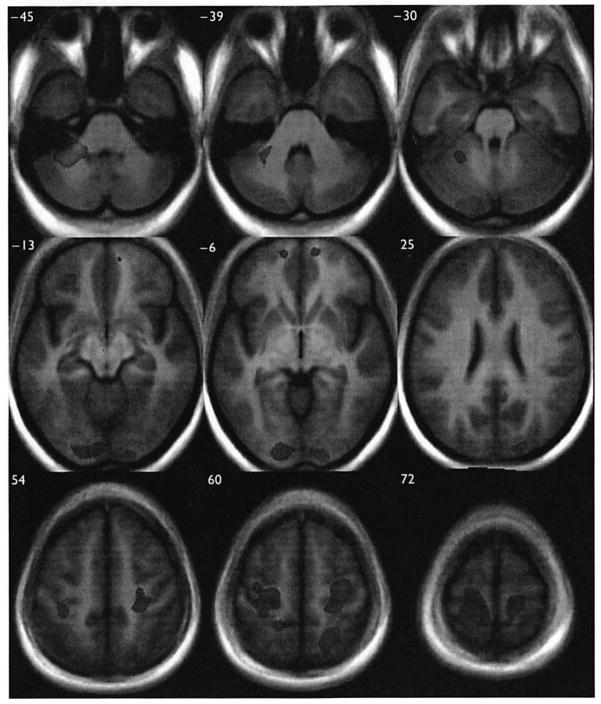
Fig. 1.
Gray matter volume differences between groups, overlaid onto TI image from study. The red-orange scale indicates relative decreases (parent < control) while the blue scale represents relative increases. For both contrasts, regions of difference shown reflect a false discovery rate threshold of 0.01. Corresponding Talairach and Tournoux Z coordinates are provided in the upper left-hand corner of each axial slice. Images are in neurological convention (i.e. left hemisphere on the left).

