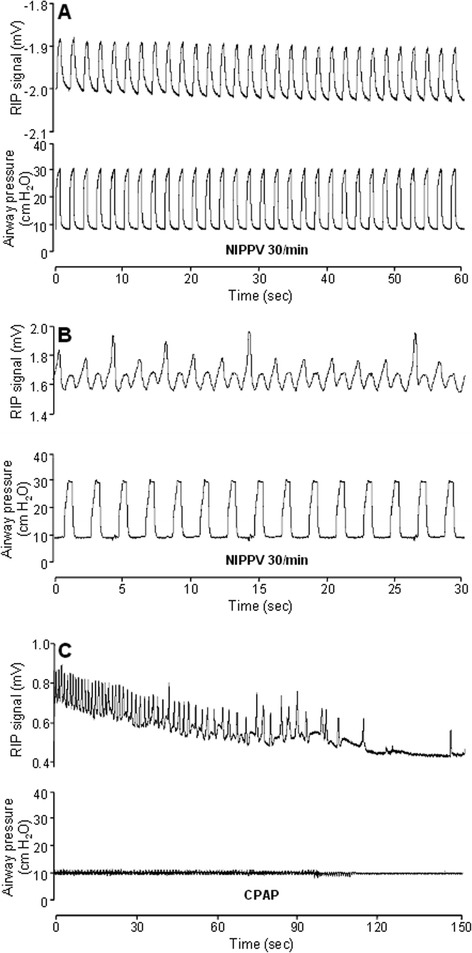
Figure 3.

Respiratory patterns (I). Representative tracings of RIP voltage (top) and airway opening pressure (bottom) during the experiment. Note differing time scales between panels. (A) Lamb 5 at 5 min of life; full NIPPV support, no spontaneous breathing. (B) Lamb 5 pre-CPAP; on NIPPV, regular spontaneous breaths seen in addition to mechanically assisted breaths. (C) Lamb 8 soon after transition to CPAP; initially regular spontaneous breathing gradually slows to apnoea. RIP, respiratory inductance plethysmography; NIPPV, nasal intermittent positive pressure ventilation; CPAP, continuous positive airway pressure.
