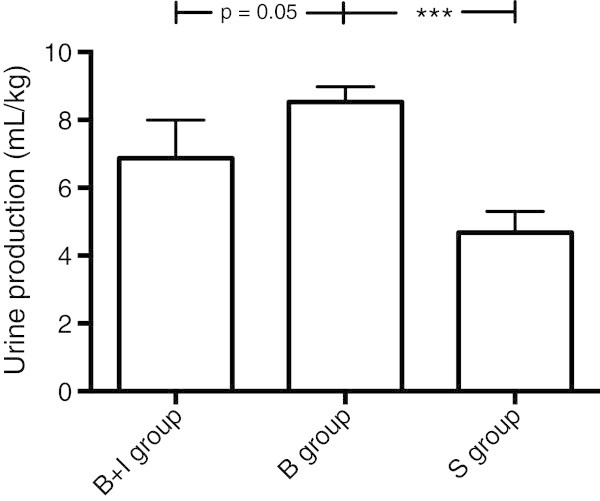
Figure 3.

Urine production. Data for urine production (mL/kg) from the end of surgical preparation to the end of the experiment. There was a significantly larger urine production in the B group compared to the S group. Student's t test was used for the statistical analyses (***p < 0.001).
