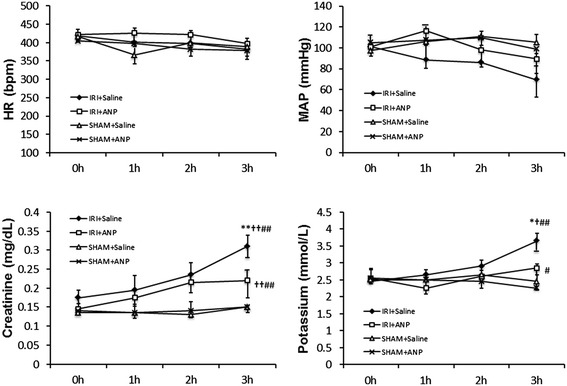
Figure 1.

Changes in the HR, MAP, and plasma concentrations of creatinine and potassium during mechanical ventilation. Values are expressed as median. Vertical lines indicate the interquartile range (IQR). ANP, atrial natriuretic peptide; HR, heart rate; IRI, ischemia-reperfusion injury (unilateral); MAP, mean arterial pressure. *p < 0.05, **p < 0.01 vs. the IRI + ANP group; † p < 0.05, †† p < 0.01 vs. the sham + ANP group; # p < 0.05, ## p < 0.01 vs. the sham + saline group.
