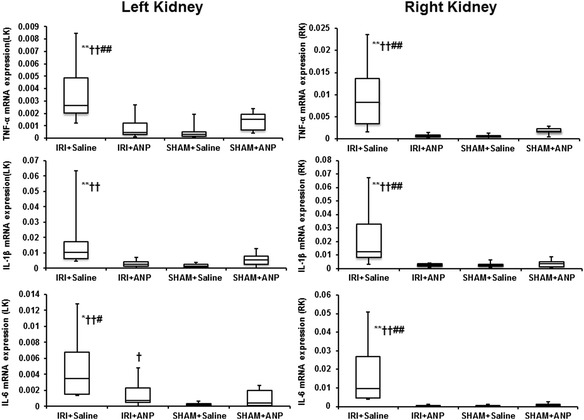
Figure 3.

Comparison of the mRNA expression of cytokines by TaqMan real-time PCR in the kidneys. ANP, atrial natriuretic peptide; IL-1β, interleukin 1-β; IL-6, interleukin 6; IRI, ischemia-reperfusion injury; LK, left kidney; RK, right kidney; TNF-α, tumor necrosis factor-α. Boxes extend from the 25th to 75th percentile; the horizontal line shows the median. Error bars show the minimum and maximum. *p < 0.05, **p < 0.01 vs. the IRI + ANP group; †† p < 0.01 vs. the sham + ANP group; # p < 0.05, ## p < 0.01 vs. the sham + saline group.
