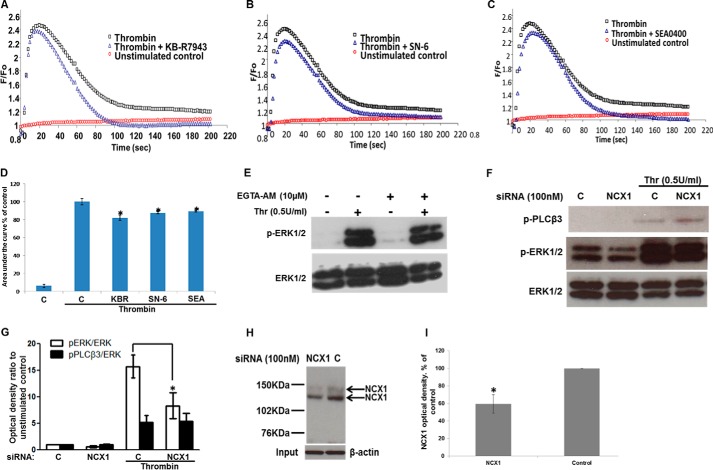
FIGURE 2.
Effect of reverse-mode NCX inhibitors on Ca2+ transients and NCX1 siRNA on ERK1/2 phosphorylation. Serum-starved HUVECs were challenged with 0.5 units/ml thrombin at time 0. Representative time courses of Fluo-4NW Ca2+-sensitive fluorescence of unstimulated control (red circles), thrombin-stimulated control (black squares), or 10 μm KB-R7943 (A), 10 μm SN-6 (B), or 1 μm SEA0400 (C) preincubation prior to thrombin stimulation (blue triangles). D, area under the curve of the Ca2+ signal in A–C was calculated. Bars represent means ± S.E. (n = 3 in triplicate). *, p < 0.05 versus thrombin-stimulated control. E, HUVECs serum-starved for 40 min in physiological buffer and treated with EGTA-AM (10 μm) or vehicle (0.5% v/v Me2SO) for a further 20 min were subsequently challenged with thrombin (0.5 units/ml) for 5 min. ERK1/2 activation was demonstrated as in Fig. 1A. n = 3. F, HUVECs transfected with nontargeting or NCX1-targeting siRNA were serum-starved and then stimulated with thrombin. ERK1/2 and PLCβ3 activation were demonstrated as in Fig. 1 (n = 3). G, optical densities of the phospho-ERK1/2 and phospho-PLCβ3 bands in F were quantified as in Fig. 1G. *, p < 0.05 versus the thrombin-stimulated control (n = 3). H, NCX1 protein was immunoprecipitated from control- or NCX1-siRNA-treated cells in experiments run in parallel to those shown in F. NCX1 protein levels were determined by Western blot. Equal protein in the input was ensured by probing for β-actin. I, optical densities of the NCX1 bands in H (n = 3). Control optical density was set to 100%. The optical density of the NCX1 protein bands from NCX1-siRNA treated cells is expressed as % change relative to the corresponding control value. Bars represent the means ± S.E. from n = 3 experiments. *, p < 0.05 versus the control.

