FIGURE 1.
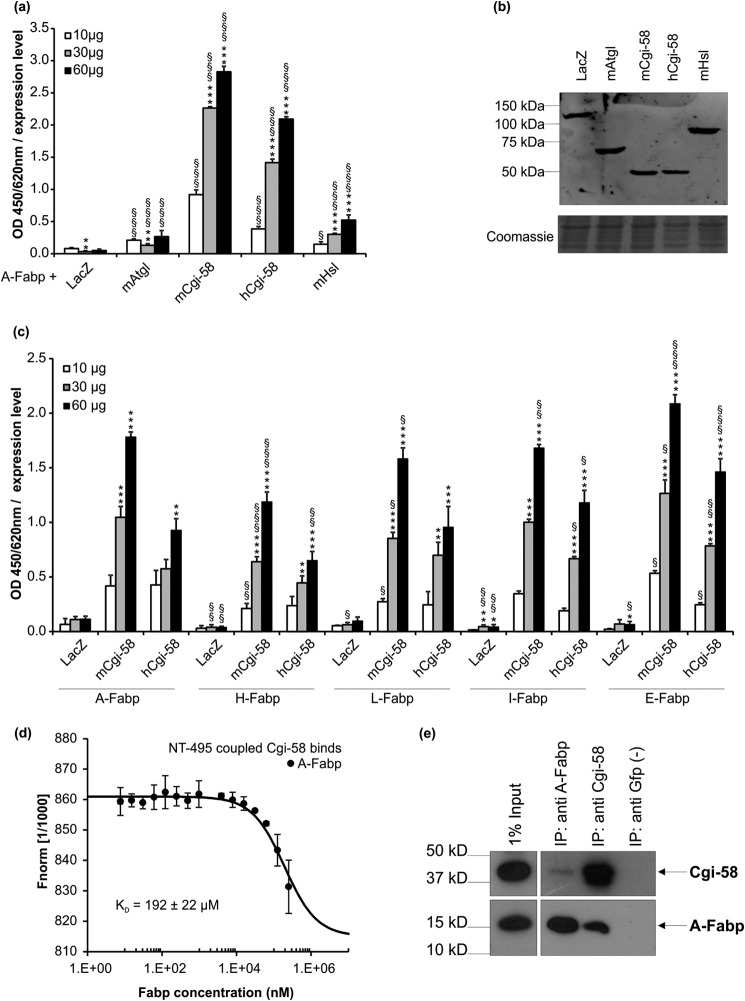
A-Fabp interacts with Cgi-58. a, in solid phase assays, polystyrene plates were coated with purified A-Fabp and incubated with lysates of COS-7 cells transfected with plasmids encoding His-tagged murine Atgl, murine or human Cgi-58, murine Hsl, and as control β-galactosidase (LacZ). Bound proteins were detected using anti-His primary and Hrp-conjugated secondary antibody. Plates were developed using tetramethylbenzidine as substrate, and the absorbance was measured at 450/620 nm. Absorbance values were normalized to the relative expression levels of prey proteins determined by densitometry. b, Western blot analysis of respective cell lysates using anti-His primary and Cy3-conjugated secondary antibody. Fluorescence was quantified in a typhoon instrument. c, Cgi-58 interacts with various Fabp isoforms. Polystyrene plates were coated with purified A-, H-, L-, I-, or E-Fabp and incubated with COS-7 cell lysates (10, 30, and 60 μg total protein) containing His-tagged murine Cgi-58, human Cgi-58, and as control LacZ, expressed at comparable levels. Binding of proteins was detected using anti-His primary and Hrp-conjugated secondary antibody. d, A-Fabp/Cgi-58 interaction demonstrated by microscale thermophoresis. Ten μmol of purified and fluorescently labeled Cgi-58 was titrated against increasing amounts of unlabeled A-Fabp and fluorescence distribution inside the capillary determined using the Monolith NT.115. Fnorm, normalized fluorescence. e, co-immunoprecipitation of endogenous A-Fabp and Cgi-58. White adipose tissue from overnight fasted mice was lysed and incubated with antibodies directed against A-Fabp, Cgi-58, or Gfp as negative control. Antibody/antigen complexes were precipitated using protein A/G-Sepharose and analyzed together with the lysate (= input) for the presence of antigens by Western blotting. Data are shown as mean ± S.D. (n = 4) and are representative of three independent experiments. Statistical difference was determined as compared with LacZ control (*, p < 0.05; **, p < 0.01; ***, p < 0.001) and of 60 and 30 μg versus 10 μg of each lysate (§, p < 0.05; §§, p < 0.01; §§§, p < 0.001).

