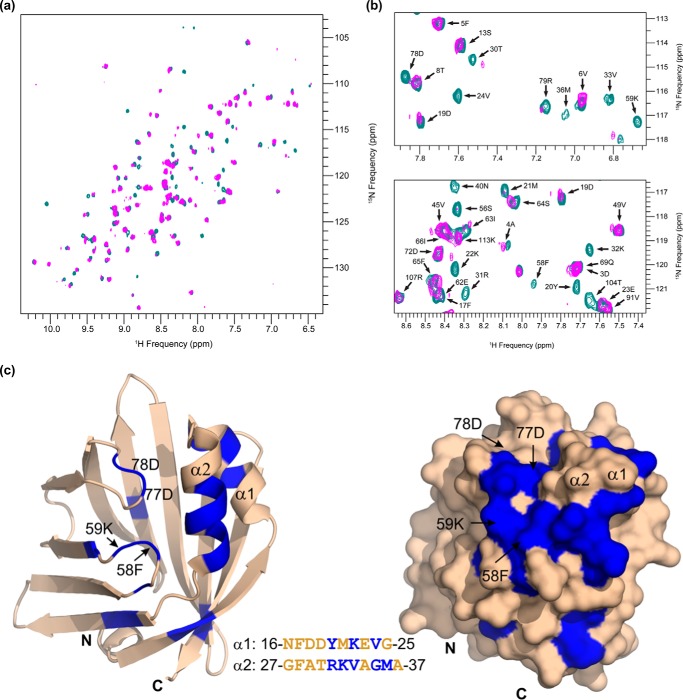
FIGURE 2.
Mapping of the A-Fabp/mCgi-58 binding interface by NMR titrations. Two-dimensional 1H-15N HSQC experiments result in a spectrum showing peaks (with their intensity values depicted in contour plots) for each N-H pair. Each peak represents a 1H-15N pair, with the respective 1H and 15N resonance frequencies. Consequently, the resulting peaks correspond mostly to backbone amide groups of A-Fabp. Assignment of the peaks to individual backbone residues was carried out upon analysis of triple resonance experiments. a, 1H-15N HSQC spectra were recorded for 50 μm 15N-labeled A-Fabp in free form (cyan) and in complex with 100 μm msolCgi-58 (magenta). Protein/protein interaction induces changes in the chemical environment of 1H-15N pairs in the binding interface and results in intensity perturbations of the peaks corresponding to the involved residues. b, selected regions of the spectrum show a subset of peaks representing free A-Fabp in cyan and A-Fabp complexed with mCgi-58 (magenta). Intensity changes in peaks corresponding to residues involved in the A-Fabp/mCgi-58 interface ranged from a significant decline of intensity to full disappearance of the magenta peaks. c, ribbon and surface representations of the three-dimensional structure of A-Fabp (Protein Data Bank code 3Q6L). Residues in blue correspond to residues experiencing a significant decrease in peak intensity upon addition of msolCgi-58. The inset shows the primary sequence of helix α1 and helix α2 with the affected residues highlighted in blue. Structure representations were prepared with PyMOL (PyMOL Molecular Graphics System, Version 1.5.0.4 Schrödinger, LLC.).

