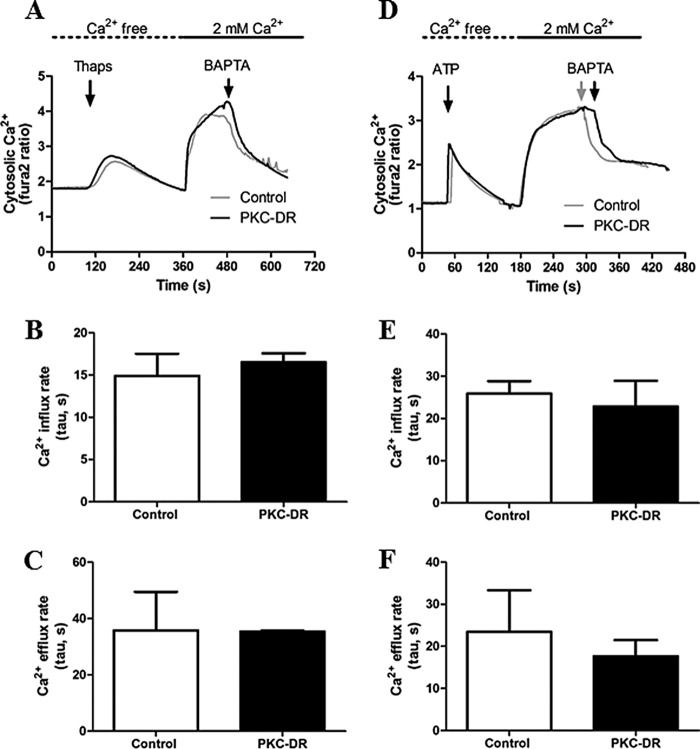
FIGURE 5.
Measurement of Ca2+ influx and efflux rates in control and PKC-DR hepatocytes. Hepatocytes were treated overnight with 4α-PMA (1 μm, Control) or PMA (1 μm, PKC-DR) and then loaded with Fura-2. Cultures were washed into Ca2+-free buffer prior to data acquisition. A—F, internal Ca2+ stores were depleted with thapsigargin (Thaps, 4 μm) (A–C) or by stimulation with the purinergic agonist ATP (200 μm) (D–F), followed by repletion of extracellular Ca2+ (2 mm) to initiate Ca2+ entry. Where indicated, the buffer was switch to Ca2+-free medium plus 5 mm BAPTA to stop Ca2+ influx and measure the rates of Ca2+ efflux from the cell. Ca2+ influx (B and E) and efflux (C and F) were plotted, and exponential rate constants (tau) were calculated using non-linear regression analysis. Similar results were obtained when the initial rates were measured (data not shown).

