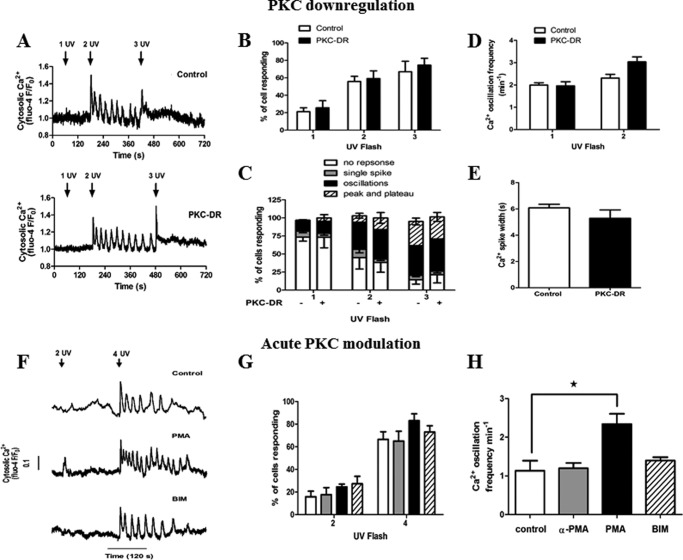
FIGURE 8.
Effects of PKC on IP3 release-induced Ca2+ oscillations. A–E, hepatocytes were treated overnight with 4α-PMA (1 μm, Control) or PMA (1 μm, PKC-DR) then loaded with caged IP3 and Fluo-4. Shown are representative traces of single control and PKC-DR hepatocytes stimulated with increasing UV light flashes (A), the percentage of cells responding to one, two, and three UV light flashes (B), the percentage of cells with no response, single spike, oscillations, or saturated (peak/plateau) Ca2+ responses (C), the oscillation frequency (D), and the spike width half-peak height (E). F—H, overnight cultured hepatocytes loaded with caged IP3 and Fluo-4 were treated with PMA (1 μm), 4α-PMA (1 μm), or BIM (5 μm) for 5 min prior to IP3 uncaging (F) representative traces. Data summarize (G) the percentage of cells responding to two and four UV light flashes and (H) the oscillation frequency after four UV flashes. Data are mean ± S.E. from ≥25 cells from four independent experiments. *, p < 0.05, analysis of variance.

