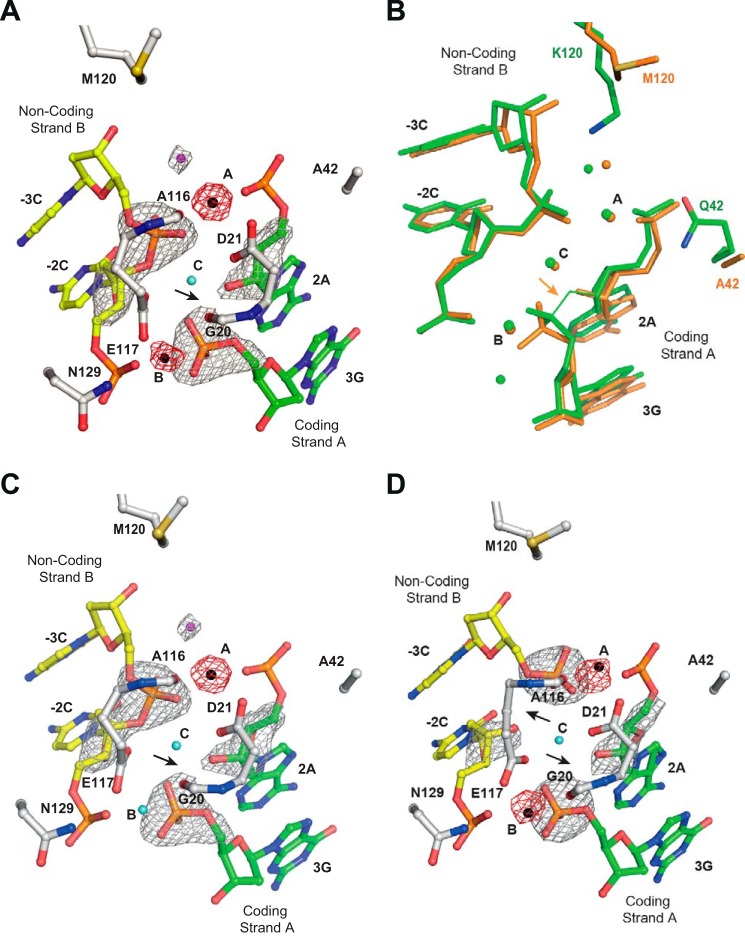
FIGURE 7.
I-DmoI Q42A/K120M characterization. A, detailed view of the I-DmoI Q42A/K120M active site in the presence of 2 mm Mn2+ and its target DNA. B, active center structure superimposition between I-DmoI Q42A/K120M (orange) and I-DmoI WT at the reactant state (green). C, detailed view of the I-DmoI Q42A/K120M active site in the presence of 2 mm Mn2+ and its target DNA nicked only in coding strand A. D, detailed view of the I-DmoI Q42A/K120M active site in the presence of 2 mm Mn2+ and its target DNA nicked in non-coding strand B. Fo − Fc omit maps (colored in gray) around the cleavable phosphodiester bonds are superimposed onto their corresponding refined structures. The omit map shows density contoured at 7σ. Anomalous maps (red) revealing the number and position of ions show density contoured at 5σ. The oligonucleotide sequence for the DNA strands is the same as in Fig. 1A. Non-coding strand B is displayed in yellow, coding strand A is colored in green, and backbone protein is shown in gray. Mn2+ ions are depicted as black spheres, structural waters are in cyan, and catalytic waters are in magenta. The arrows point to the phosphodiester bond cleaved.

