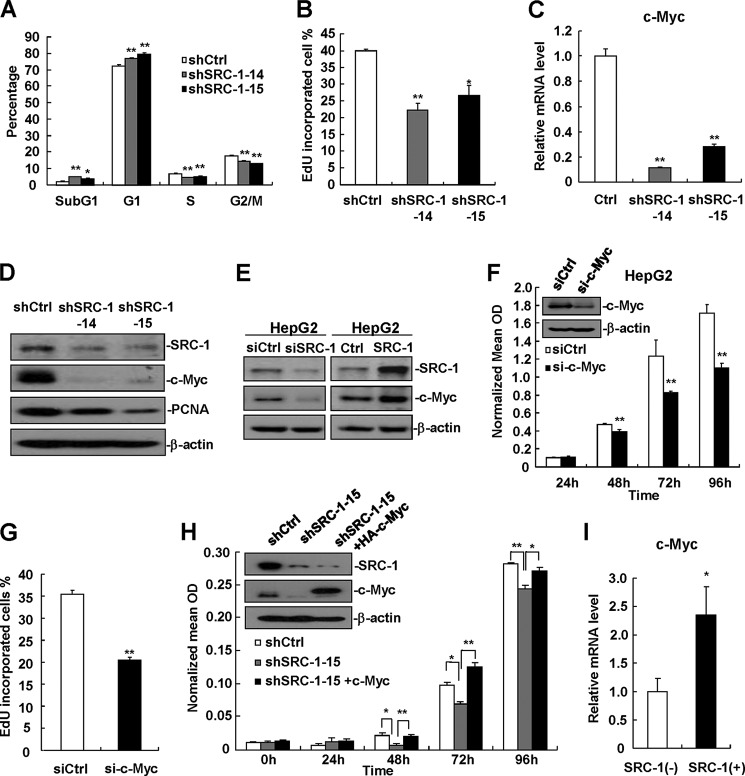
FIGURE 3.
Down-regulation of SRC-1 decreases c-Myc expression. A, cell cycle analyses of stable SRC-1-knockdown cells and control cells were performed by flow cytometry. A total of 4 × 10⁵ cells were seeded into 6-well plates, synchronized by serum starvation for 24 h, and re-entered into the cell cycle by an exchange of 10% FBS DMEM for 24 h. Cell were harvested, and cell cycle status was measured by flow cytometry. This experiment was performed three times with similar results. B, down-regulation of SRC-1 decreased DNA synthesis. DNA synthesis analyses of stable SRC-1-knockdown cells and control cells were performed by EdU staining. This experiment was performed twice with similar results. C, c-Myc mRNA levels were significantly decreased in stable SRC-1-knockdown cells. c-Myc mRNA levels were measured by real-time PCR. Relative quantification was achieved by normalization to GAPDH. This experiment was performed twice with similar results. D, c-Myc and PCNA protein levels were significantly decreased in stable SRC-1-knockdown cells, as measured by Western blot analysis. This experiment was performed twice with similar results. E, SRC-1 positively regulated c-Myc protein levels. Either SRC-1-specific siRNAs or SRC-1 expression constructs were transfected into HepG2 cells for 48 h. Cells were then harvested for Western blot analysis. This experiment was performed three times with similar results. F, knockdown of c-Myc decreased proliferation in HepG2 cells, as measured by MTT assay. This experiment was performed twice with similar results. G, knockdown of c-Myc decreased DNA synthesis. DNA synthesis analyses of c-Myc-knockdown cells and control cells were performed by EdU staining. This experiment was performed twice with similar results. H, transfection of c-Myc into SRC-1-knockdown cells restored cell proliferation. Control constructs were transfected into wild-type control cells, and control constructs and c-Myc expression constructs were transfected into SRC-1-knockdown cells for 48 h, respectively. A total of 3000 cells were then seeded into 96-well plates for cell proliferation analyses using an MTT assay. This experiment was performed twice with similar results. I, c-Myc mRNA levels in SRC-1-positive (+) human HCC specimens were significantly higher than those in SRC-1-negative (−) HCC specimens. c-Myc mRNA levels were measured by real-time PCR. Relative quantification was achieved by normalization to GAPDH. *, p < 0.05; **, p < 0.01. Error bars, S.E.

