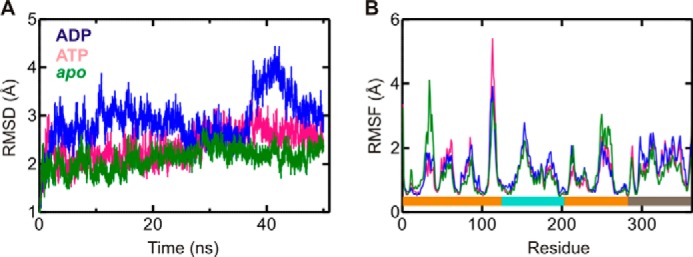
FIGURE 4.

Structural dynamics of YchF during MD simulations. A, r.m.s.d. of E. coli YchF in complex with ATP (pink) or ADP (blue) or in its apo state (green) with respect to its initial conformation. r.m.s.d. values were calculated using all backbone atoms. B, Cα r.m.s.f. for E. coli YchF in complex with ATP (pink) or ADP (blue) or in its apo state (green). Colored bars at the bottom indicate the different domains of the protein: G-domain (orange), A-domain (teal), and TGS domain (gray).
