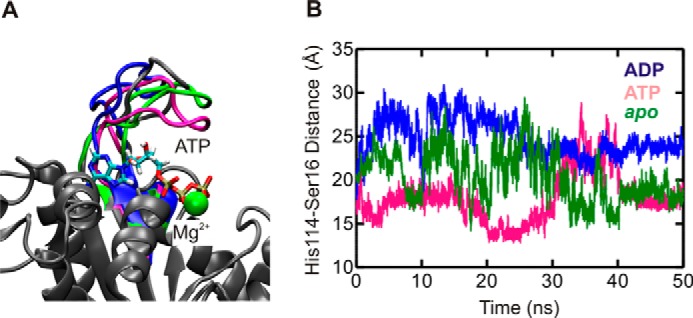
FIGURE 6.

MD simulations reveal different conformations of the flexible loop. A, final structures of YchF·ATP·Mg2+ (pink), YchF·ADP·Mg2+ (blue), and apo-YchF (green) after 50 ns of simulation aligned with pre-simulation structures (gray). B, distance between the α-carbons of His-114 and Ser-16 over a 50-ns simulation of YchF·ATP·Mg2+ (pink), YchF·ADP·Mg2+ (blue), and apo-YchF (green).
