FIGURE 4.
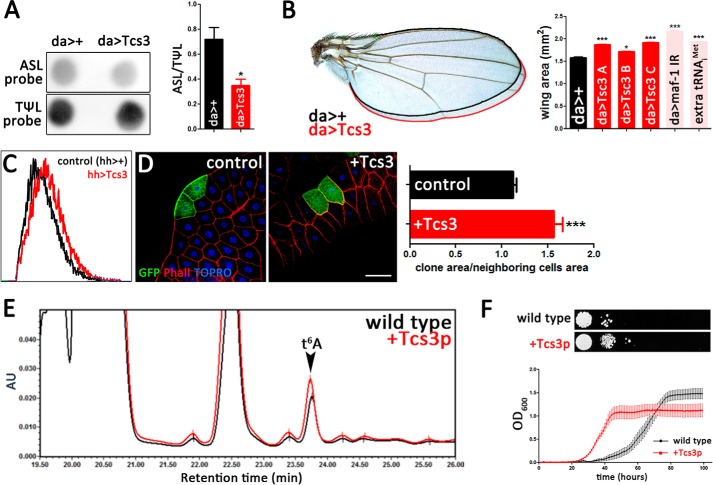
An increment of t6A-modified tRNAs promotes growth cell-autonomously. A, representative image of PHAt6A assay in samples from control and Tcs3-overexpressing animals. Signal intensity was quantified and plotted as ASL/TΨL ratio (n = 4 samples). B, a comparison between control (black line) and Tcs3-overexpressing wings (red line). Wing area was plotted showing that Tcs3 significantly promotes growth (n = 50 wings). As controls we used two other UAS insertions located in the second and third chromosome (Tcs3(B) and Tcs3(C)) were able to promote animal growth. Likewise other interventions with known effects on animal growth are: Maf1 knockdown and the addition of an extra locus of tRNAiMet. Measurements of wing area from control (da>+) and experimental animals show that these manipulations favor animal growth in a comparable range (n = 50, p < 0.005 to control). C, flow cytometry was used to compare cell size in Tcs3-overexpressing and control cells. hedgehog-Gal4 driver (hh>Gal4) was used to express Tcs3 and GFP in the wing posterior compartment, whereas control cells were obtained from the anterior compartment of the same imaginal discs (no GFP). Histogram are representative of 3 independent experiments. D, FLP-out Tcs3-overexpressing mosaic analysis (bar = 100 μm). Control clones express GFP only, whereas Tcs3-overexpressing clones express Tcs3 and GFP. Clone area was measured and normalized by the area of its neighbor cells; these ratios are presented in the chart (n = 50 cells). Wild-type yeast strain (BY4741) was transformed with empty pDEST52 vector (control) or with a pDEST52 construct to overexpress the D. melanogaster Tcs3p coding sequence (+Tcs3p). E, plot representing an archetypal HPLC elution profile of nucleosides from control (black line) or Tsc3p-overexpressing yeast (red line). AU, arbitrary units. F, serial dilution assays (1:10) were made from a suspension of cells with A600 = 0.6. Growth assay in liquid media were made measuring simultaneously the A600 of 10 independent wells and the plot is representative of 3 independent experiments.

