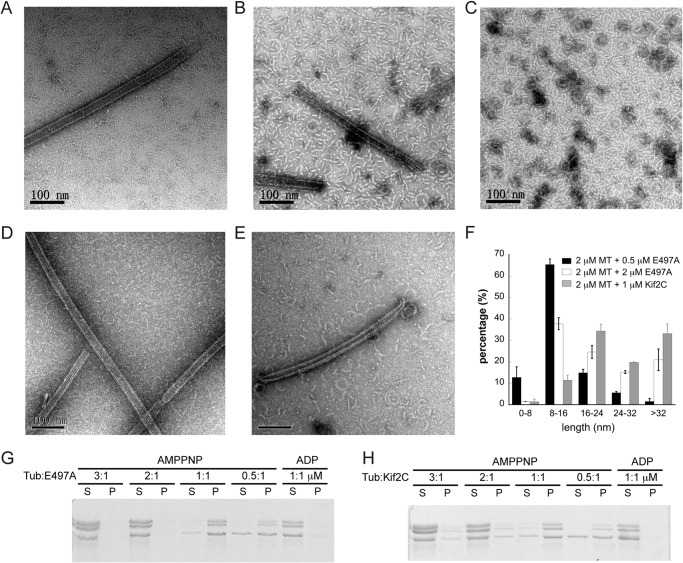
FIGURE 5.
The 1:2 binding stoichiometry between the E497A Kif2C-(sN+M) and tubulin. A–C, negative staining EM images of microtubules (A), 2 μm microtubules depolymerized by 0.5 μm Kif2C-(sN+M)-E497A (B), and 2 μm microtubules depolymerized by 2 μm Kif2C-(sN+M)-E497A (C) in the presence of ATP for 15 min. D and E, negative staining EM images of 2 μm microtubules treated with 1 μm wild type Kif2C-(sN+M) in the presence of 1 mm AMPPNP for 1 min (D) and 15 min (E). F, length distribution of tubulin oligomers observed in negative staining EM images. For each condition, images of two different fields were used for statistics. In the case of wild type Kif2C-(sN+M), statistics are from the 15-min incubation time. G, aggregation of tubulin:Kif2C-(sN+M)-E497A as a function of the concentration ratio. The result was analyzed by SDS-PAGE following ultracentrifugation. H, same experiment as in G, but with wild type Kif2C-(sN+M).

