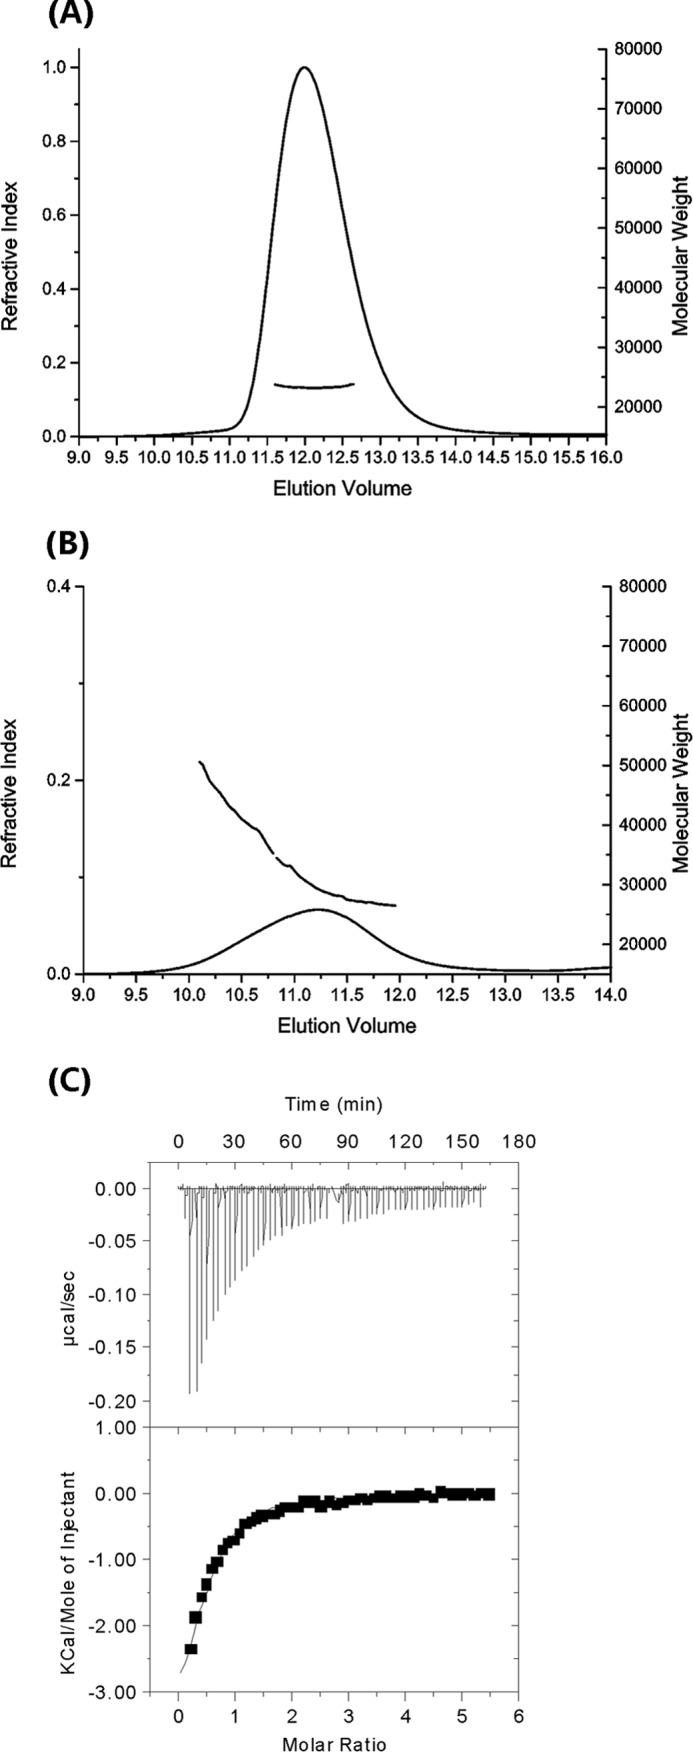
FIGURE 3.

MALLS and ITC analyses. A and B, MALLS data for NCS-1, showing a peak consistent with a monodisperse sample and an expected molecular mass of 21,880 ± 200 daltons. The average molecular mass per volume unit is shown in gray and the differential refractive index in black. B, MALLS data for Ca2+/NCS-1(1–177) (NCS-1ΔCT), the protein elutes as a polydisperse peak with molecular mass ranging from 29,300 to 42,000 daltons. Other details are as for A. C, ITC titration data for the binding of the D2R peptide to NCS-1; data from two runs were concatenated to achieve a saturating isotherm. The data were fitted to a two-site binding model to yield Kd values of 40 ± 6 μm.
