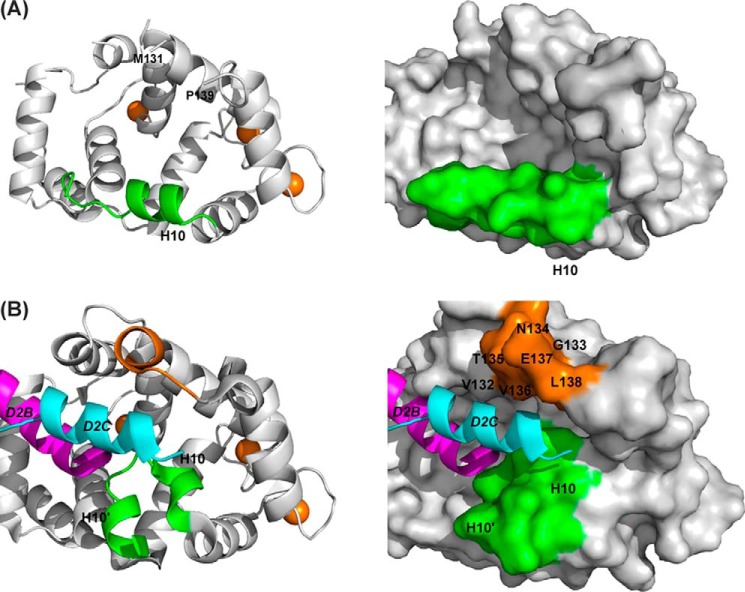
FIGURE 6.
Comparison of the conformation of the C-lobe in unliganded rat Ca2+/NCS-1 and the NCS-1·D2R complex. A, backbone schematic (left) and molecular surface representation (right) of the C-lobe of unliganded NCS-1 (PDB code 5AEQ). The C-terminal helix 10 is colored green, and Ca2+ ions are shown in brown. Electron density for Val-132–Leu-138 was weak, and these residues were therefore omitted from the model. B, backbone schematic and molecular surface representations of the C-lobe of NCS-1·D2R complex (PDB code 5AER). The C-terminal helix-loop-helix (helices 10 and 10′) formed by residues Pro-177–Leu-189 is colored green. The D2B peptide in the N-site is colored magenta; the D2C peptide in the C-site is colored cyan, and residues Val-132–Leu-138 are colored brown.

