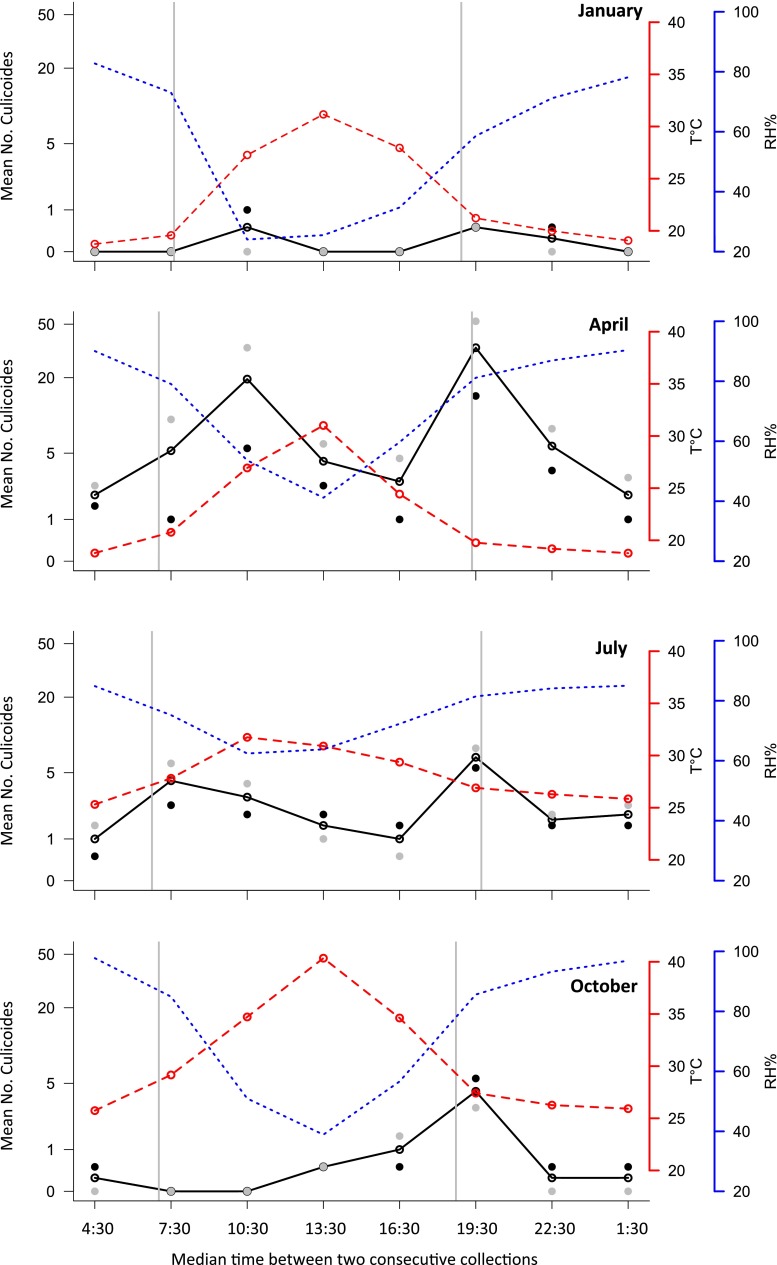
Fig. 1.
Circadian activity of Culicoides oxystoma through four seasons of 2012 using a sheep-baited trap in the Niayes area, Senegal. Legend: black lines—the mean number of collected specimens (log 10 scale), gray dots—the mean number of males, black dots—the mean number of females, red dashed lines—average temperatures (°C), blue dashed lines—average relative humidity (%). Gray vertical bars represent sunrise and sunset time

