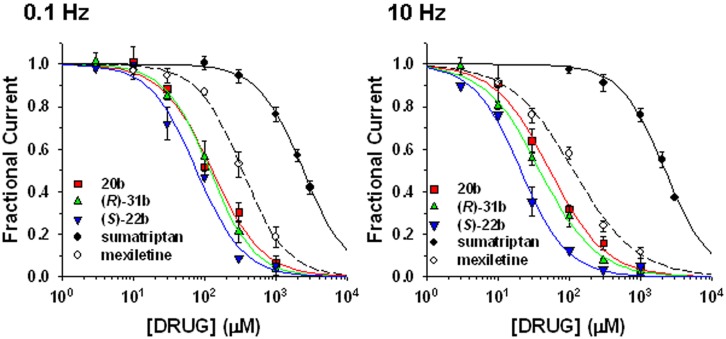
FIGURE 3.
Concentration–response relationships for mexiletine, sumatriptan, and its three analogs on hNav1.7 channels. The curves were constructed at 0.1 and 10 Hz frequency stimulations from peak amplitude values of sodium currents recorded as described in Figure 2, and fitted with Eq. 1 given in the “Materials and Methods” section. Each data point is the mean ± SEM of at least three cells. The fit parameters together with the SE of the regression are given in Table 1. Statistical analysis is reported in Table 2.

