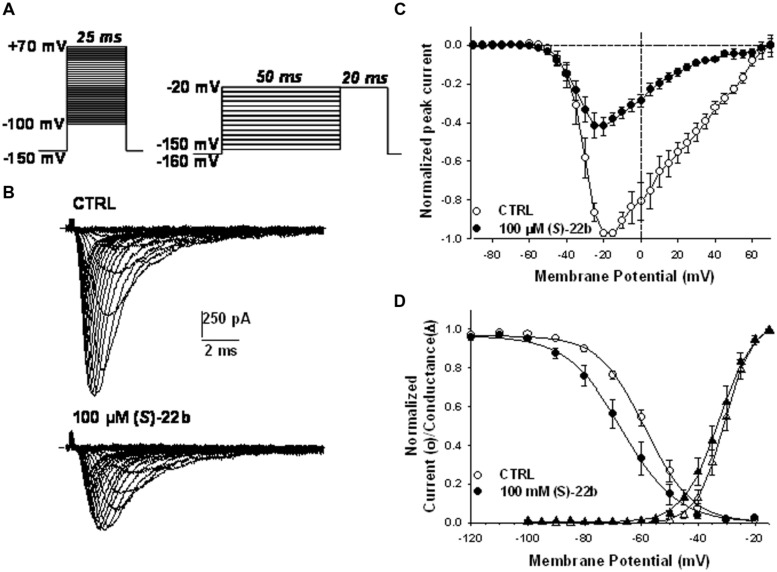
FIGURE 4.
Effects of 100 μM (S)-22b on the voltage dependence of hNav1.7 channels. (A) Left protocol, to obtain the current–voltage (I–V) and activation relationships, the membrane was held at –150 mV and depolarized by successive 25 ms-long voltage steps ranging from –100 to +70 mV applied in 5-mV increments every 10 s. Right protocol, to obtain the voltage dependence of steady state availability (fast inactivation), the membrane was held at –160 mV, and conditioning 50 ms-long voltage steps were applied from –120 to –20 mV in 10-mV increments, before to apply a 20 ms-long test pulse at –20 mV. (B) Families of sodium currents recorded in a representative cell using the left protocol shown in (A), in control conditions (CTRL) and at steady state during the application of 100 μM (S)-22b. (C) Averaged I–V relationships obtained using the left protocol shown in (A). In each tested cell, the peak current amplitude measured in CTRL and in presence of 100 μM (S)-22b was normalized with respect to maximal peak current amplitude recorded in CTRL. Each point value is the mean ± SEM calculated from eight cells. (D) The voltage dependence of activation (triangles) was drawn by reporting the normalized conductance, calculated from the I–V curves with Eq. 2, as a function of test pulse voltage and fitted with Eq. 3. The voltage dependence of channel availability (circles) was drawn by reporting the normalized peak sodium current amplitude measured during the test pulse as a function of conditioning pulse voltage (right protocol in A), and fitted with Eq. 4. Each point value is the mean ± SEM calculated from eight cells. The averaged fit parameters, calculated from the relationships obtained in each cells, are reported in the text.

