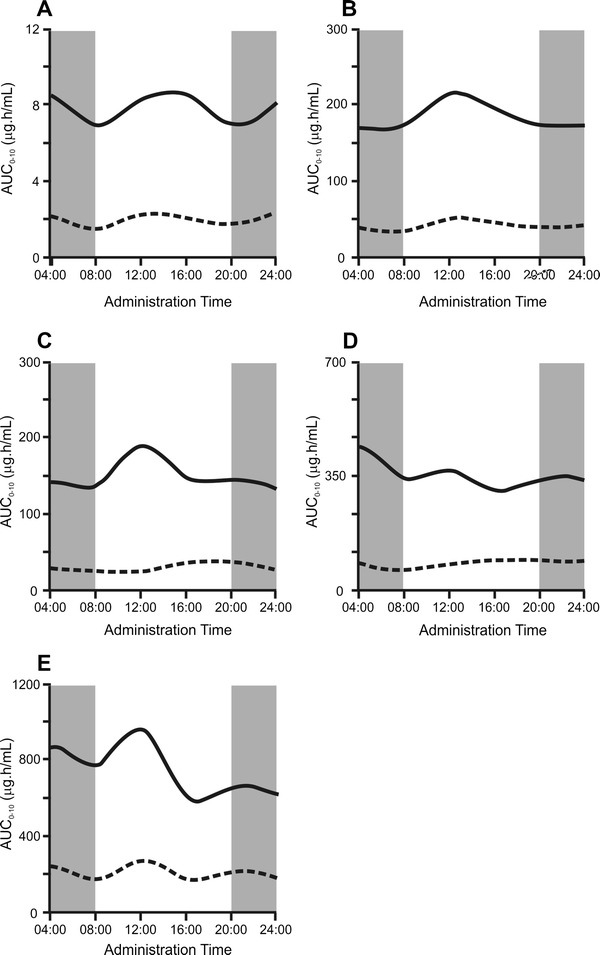
Fig. 1.

Daily variations in the area under the concentration–time curve (AUC) for sunitinib (solid lines) and SU12662 (dotted lines) in plasma (a), liver (b), duodenum (c), jejunum (d), and ileum (e) of FVB mice treated with a single dose of sunitinib. The x axis indicates the time of sunitinib administration, the y axis represents the mean AUC corresponding to the six consecutive administration times. Gray areas indicate it was dark in the cages of the mice, white areas indicate it was light. AUC 0–10 area under the concentration–time curve from time zero to 10 h
