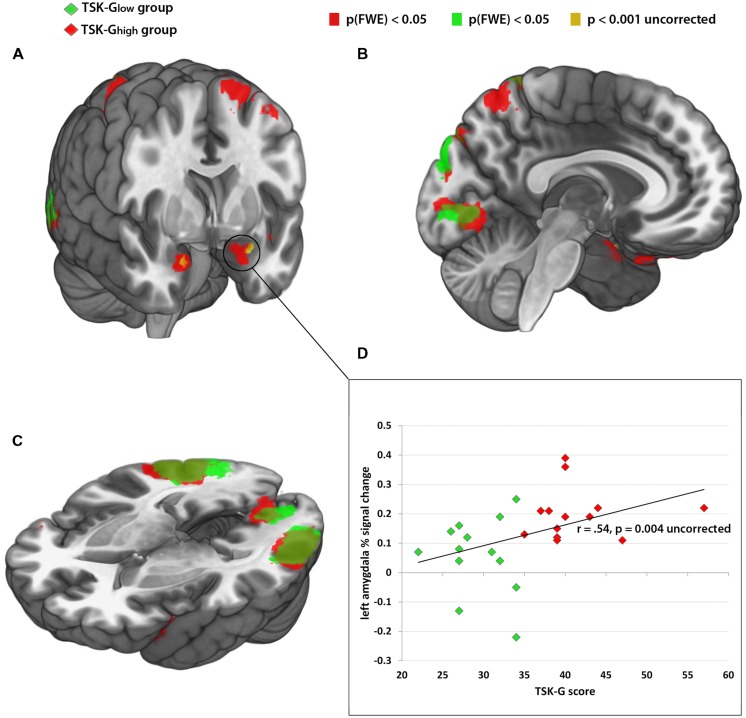
FIGURE 2.
(A–C) Red color: brain activity of TSK-Ghigh group from the contrast “harmful activities > baseline,” p(FWE) > 0.05. Green color: brain activity of TSK-Glow group from the contrast “harmful activities > baseline,” p(FWE) > 0.05. Yellow color: enhanced brain activity of the TSK-Ghigh group compared to the TSK-Glow group of the contrast “harmful activities > harmless activities” p > 0.001, uncorrected. (D) Correlational analysis between left amygdala activity (% signal change) and TSK scores. Red dots indicate TSK-Ghigh scorers, green dots indicate TSK-Glow scorers.

